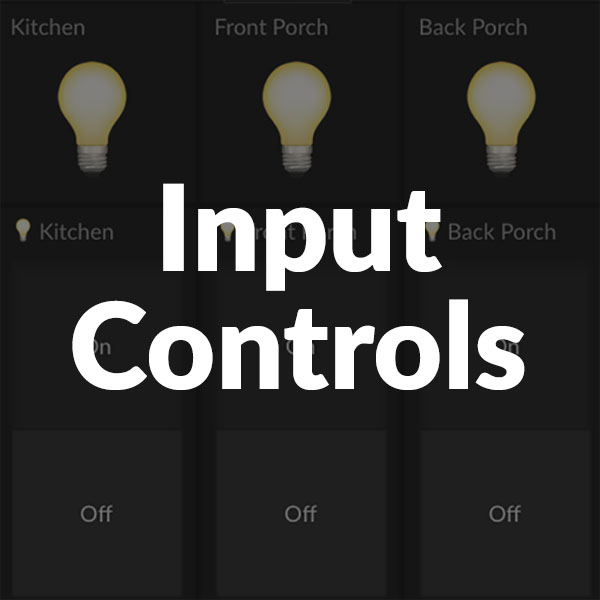
Introduction to Input Controls
Being able to control things directly from a Tiles dashboard has been one of the most requested Initial State user features. You now have the option to add four new input control tile types to your dashboard - button, switch group control, range control, and text field control. When combined with the Initial State Read API (more info), input controls give you the ability to design your own device control experience on either a desktop or mobile device.
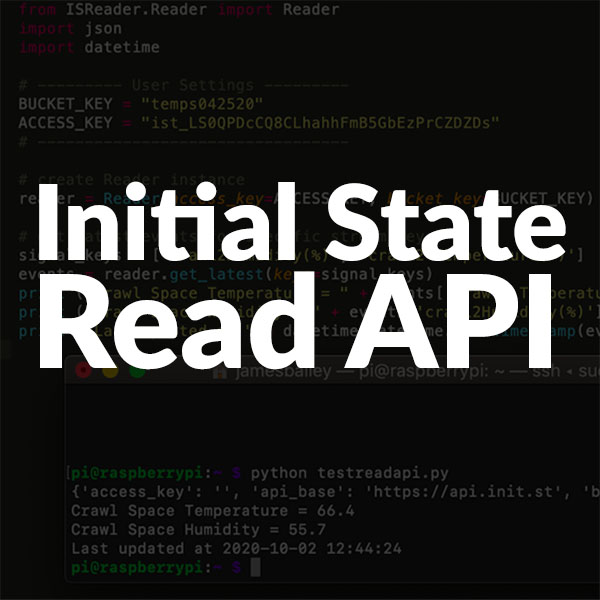
Introduction to the Initial State Read API
Initial State has always had an incredibly easy-to-use API for streaming data into your account. What has been missing is a similar API for reading data out of your account. That gap has now been filled with the release of the Initial State Read API. You can now enable read access to any of your data buckets and read the latest value from any data stream with a single API call. We have also released a new Python module to make accessing the Read API even easier.
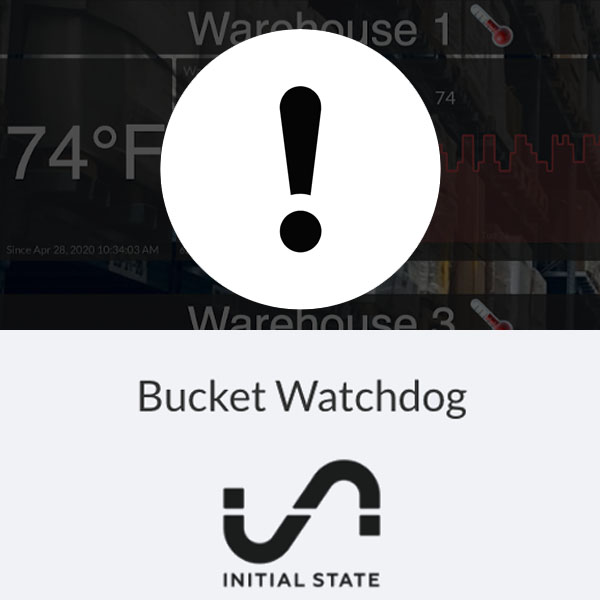
Logging and Supervising Your Remote Temperature Monitor
What if one of your wireless sensors goes offline without you knowing? That’s where Initial State’s new Bucket Watchdog service comes in. Learn how to use Bucket Watchdog to alert you when your data stops.
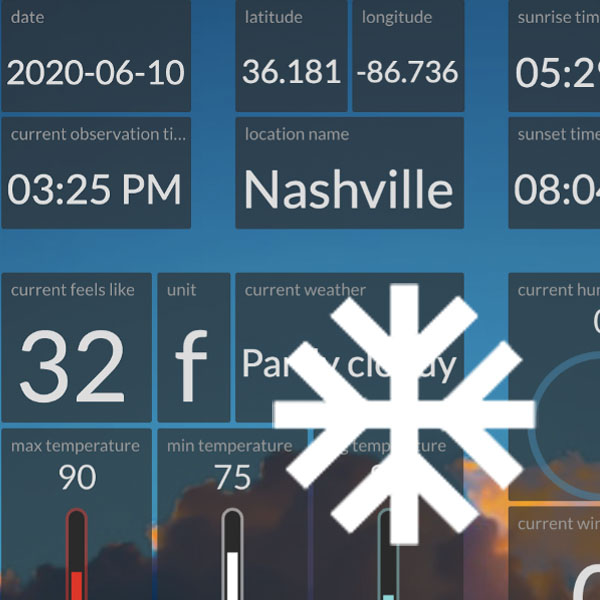
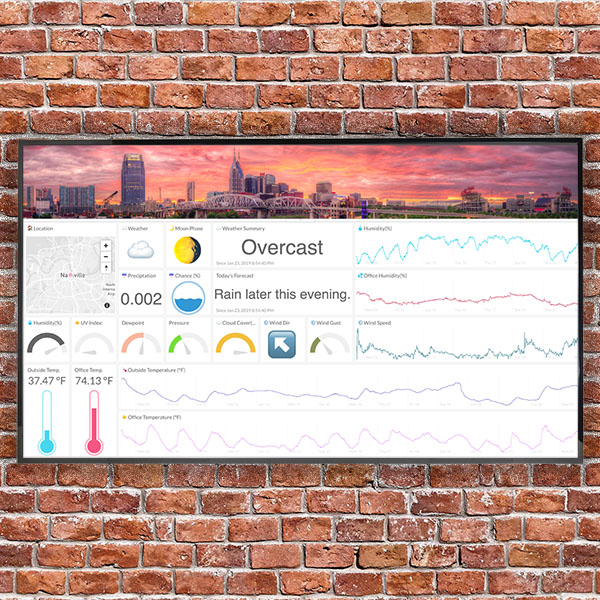
Build a Weather Dashboard that sends alerts
Being a Tornado Survivor, I use many ways to get weather alerts. I made a weather dashboard using a weather data API that can text me based on my custom criteria.
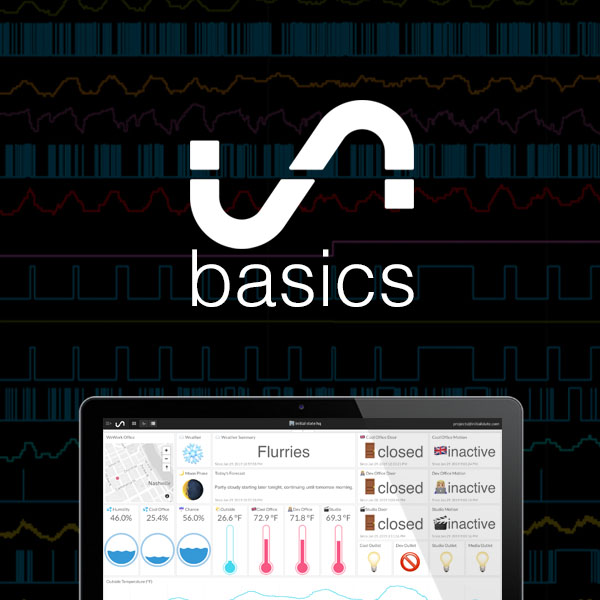
Getting Started with Initial State
Quickly get up and running with your Initial State account. Learn the basics of how to stream data into your account, how to build a dashboard, transform data, set a trigger notification, share data, and more.
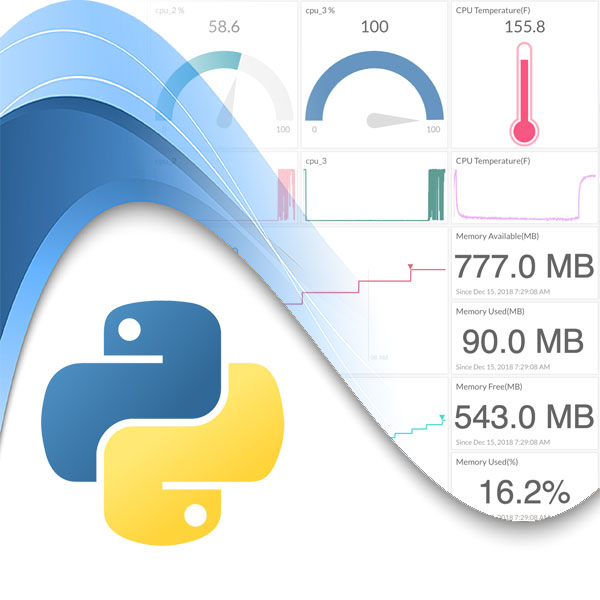
How to Stream (Push) Data to a Dashboard API in Python
If you are building projects in Python, there is a good chance you will want to capture some sort of data on occasion. You might even want to build a dashboard out of that data. For example, a dashboard of performance data (e.g. CPU usage). Or, a dashboard full of sensor data (e.g. temperature). Maybe a dashboard displaying the status of critical processes. If it is data you can access in your Python code, you can easily build a real-time dashboard from that data.
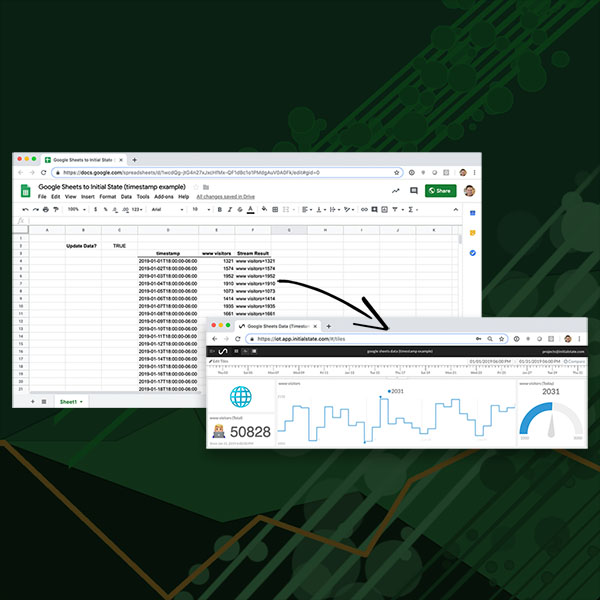
How to Stream Your Google Sheets Data to a Real-Time Dashboard
Spreadsheets excel at (see what I did there …) manipulating data in all kinds of crazy ways. However, they tend to be a rather boring tool for displaying / sharing KPIs and other key summary data. This tutorial will show you a simple, inexpensive way to create a beautiful, sharable, real-time updating dashboard from your Google Sheets data.
Build a Simple Dashboard Web Server
Do you want to create a beautiful, customized dashboard full of all your important data for display on a big television, small LCD, your laptop, or to share with your colleagues/boss at work? Maybe you want to wrap custom images, animations, or buttons around your dashboard. One way to accomplish this is by creating a custom web page and hosting it from an inexpensive device like a Raspberry Pi.
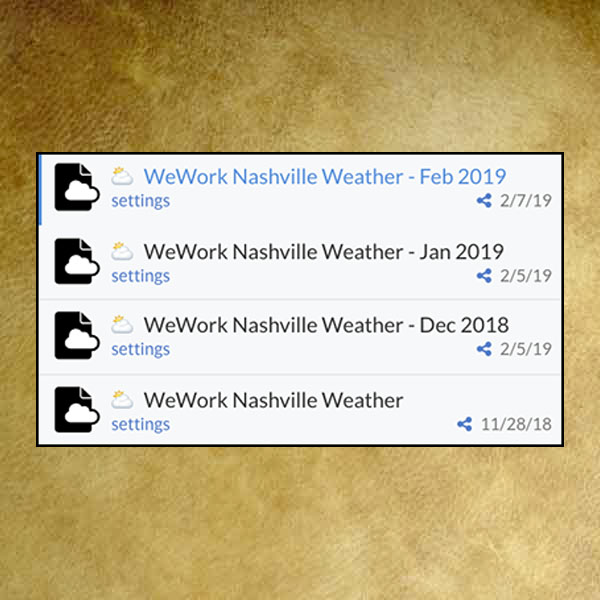
Tuck Away a Specific Month/Week/Day View of Your Data
If you have a set of sensors or an application streaming data over a long period of time, there is a good chance you are, at some point, going to want to look at data from the past. For example, if you are streaming energy usage data, you might want to compare last February’s usage to this February. Luckily, there are a couple of cool features in your Initial State account that let you easily tuck away custom views of your data from specific time ranges.