Compute Energy Costs
Overview
Compute energy costs from Watts logged. This operation will use a combination of the summary statistics tile view and real-time expressions. Two methods to generating energy costs from Watts will be described, each with its own advantages and disadvantages.
Method 1
Syntax
Tile Type: Summary Total (Events measured in Hours).
Real-Time Expression:
=[data stream]/1000*<cost per kWh>
Example
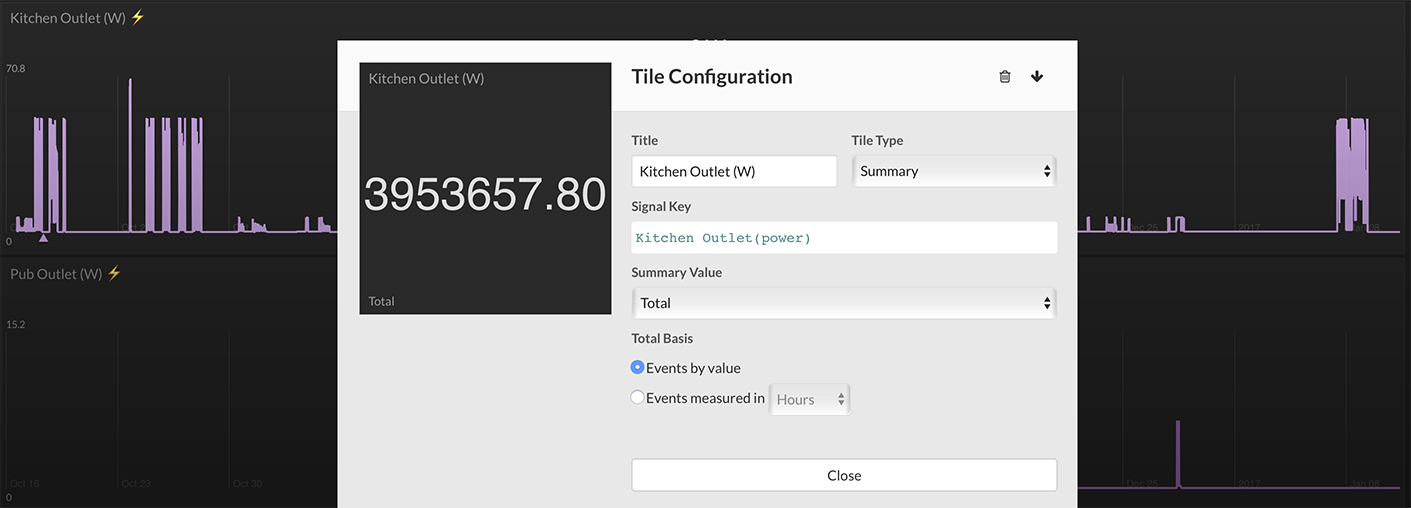
A data stream from a smart outlet, power2, is logging data in Watts. This data stream needs to be converted to cost.
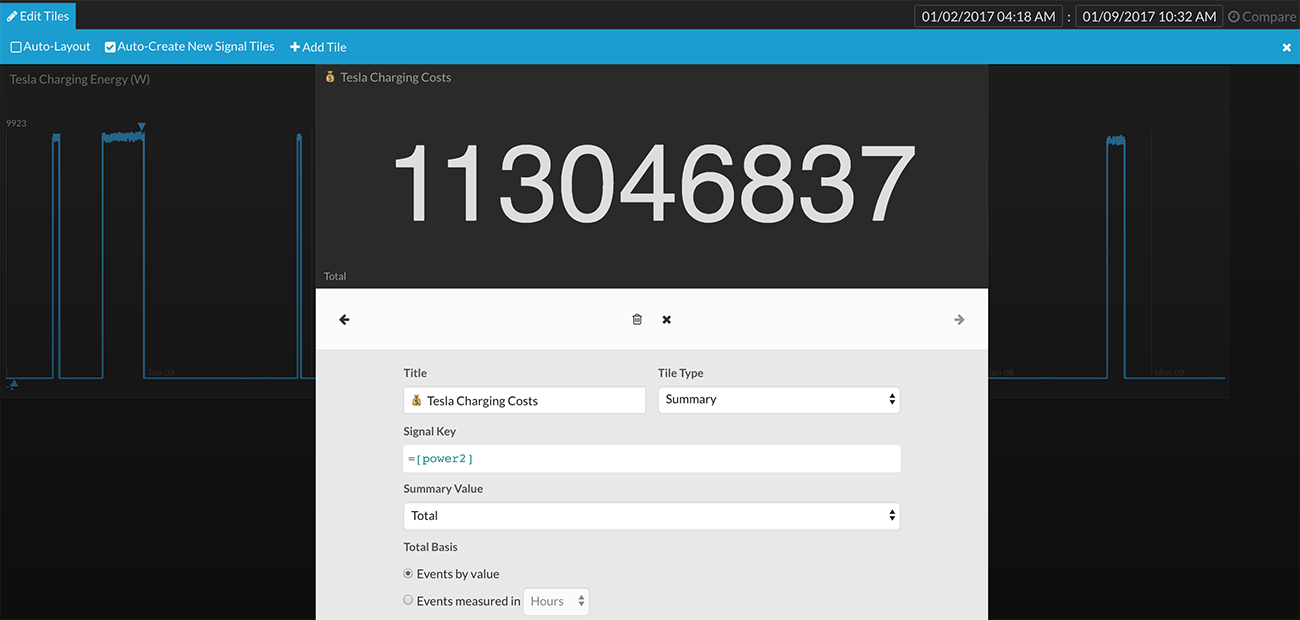
Add a tile and select the Tile Type to be Summary. Under the Summary Value drop-down, select Total. There are two options under Total Basis. Events by value will simply add up every value in the data stream into a single summation. In the example above, there have been 113,046,837 Watts logged over time.
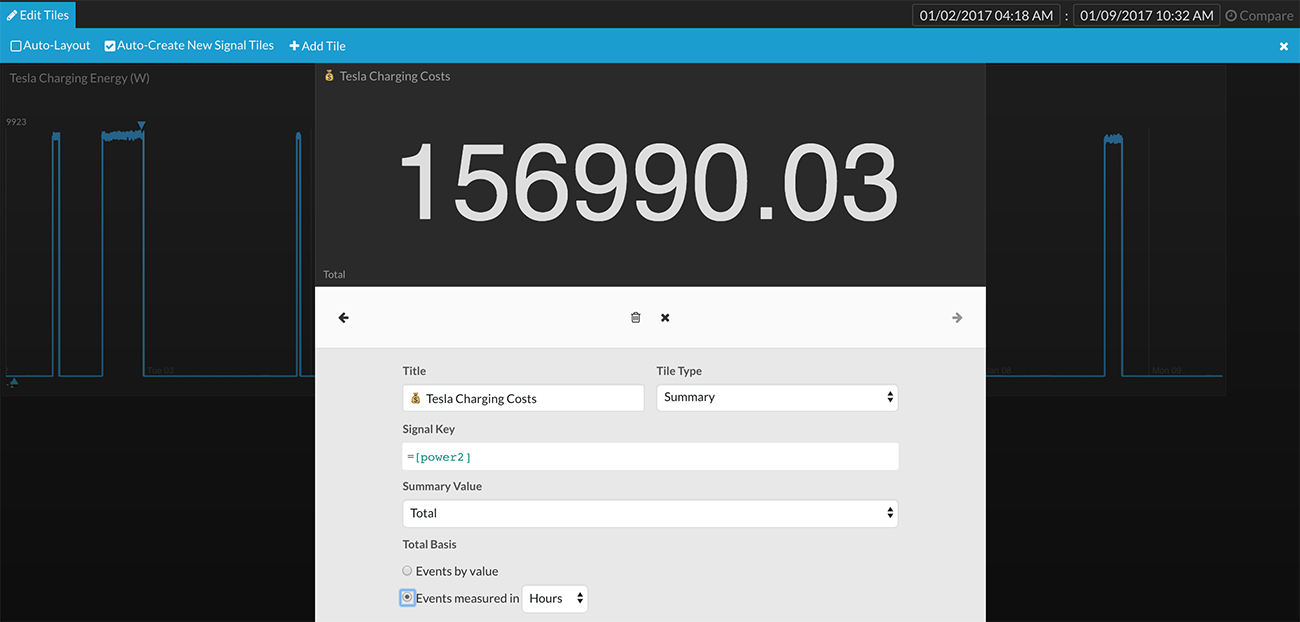
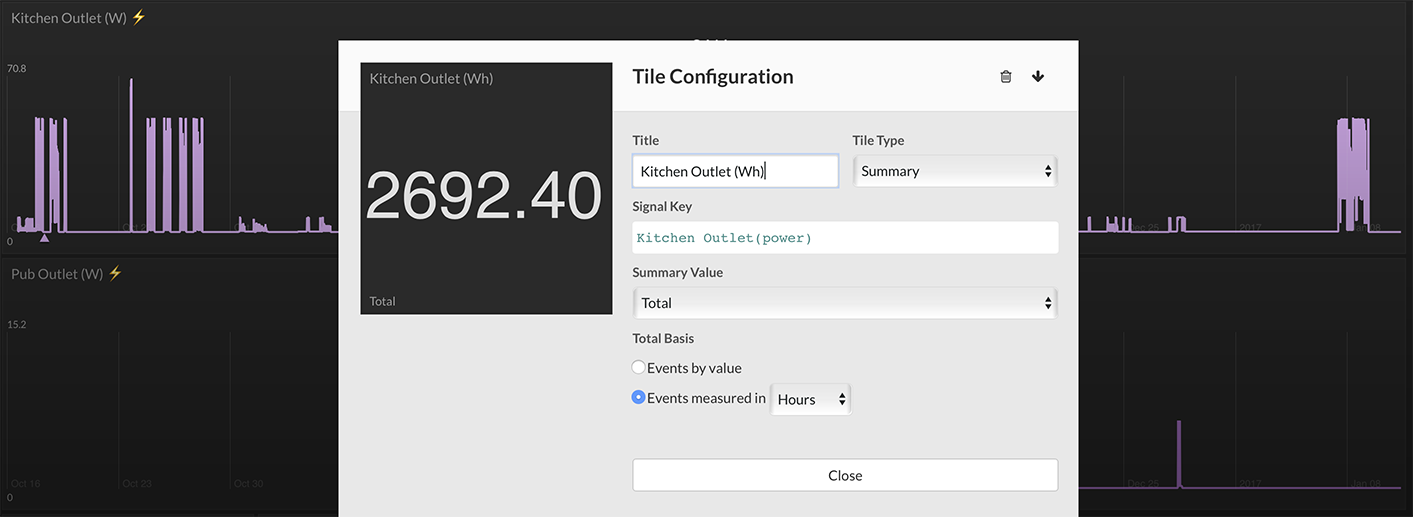
Watts needs to be converted to Watt-hours (Wh). To do this, simply select the second option under Total Basis, Events measured in Hours. In the example above, there have been 156,990.03 Wh used.
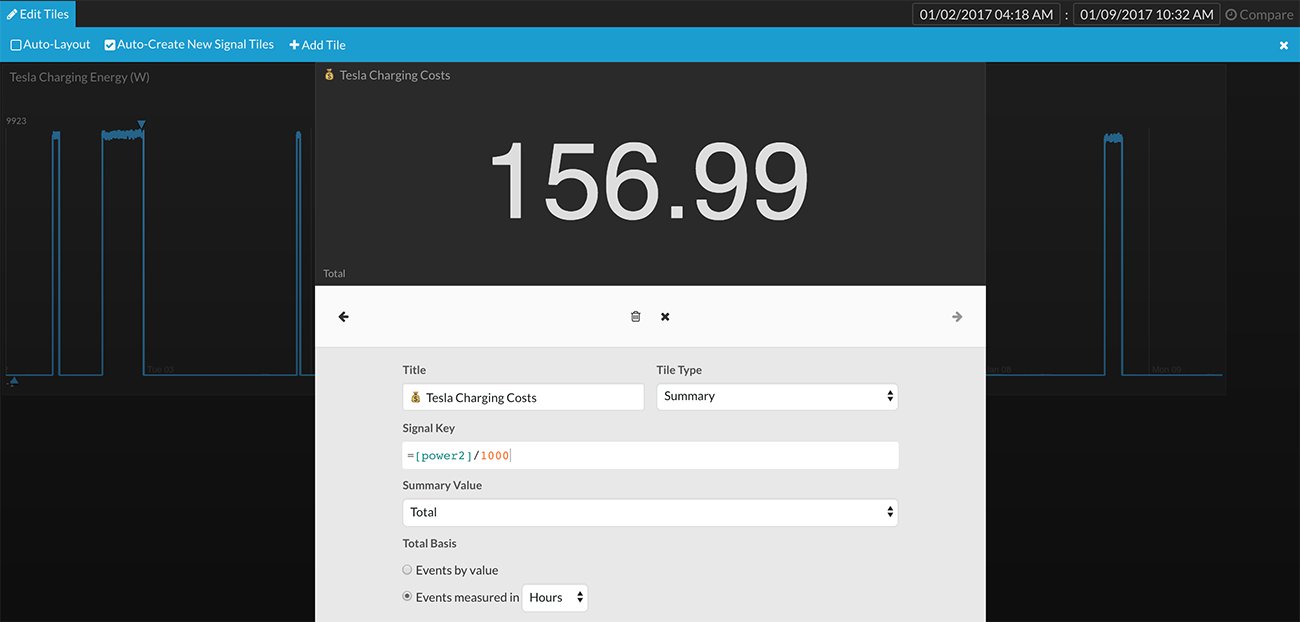
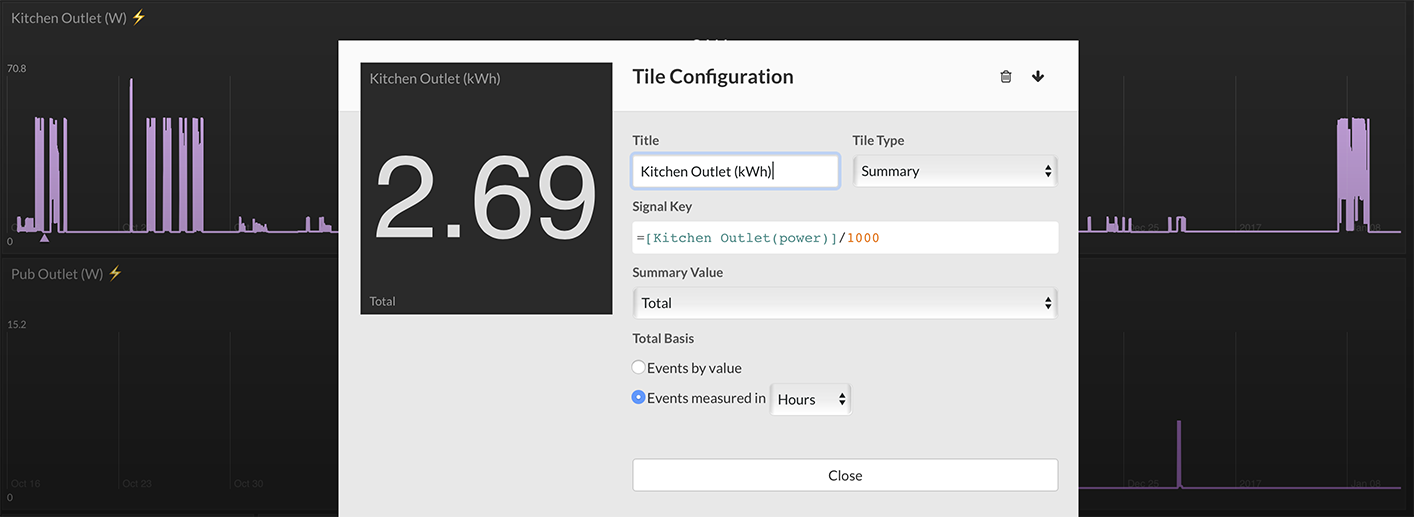
Next, convert Wh to kWh by using a simple real-time expression to divide by 1000. In the example above, the expression is:
=[power2]/1000
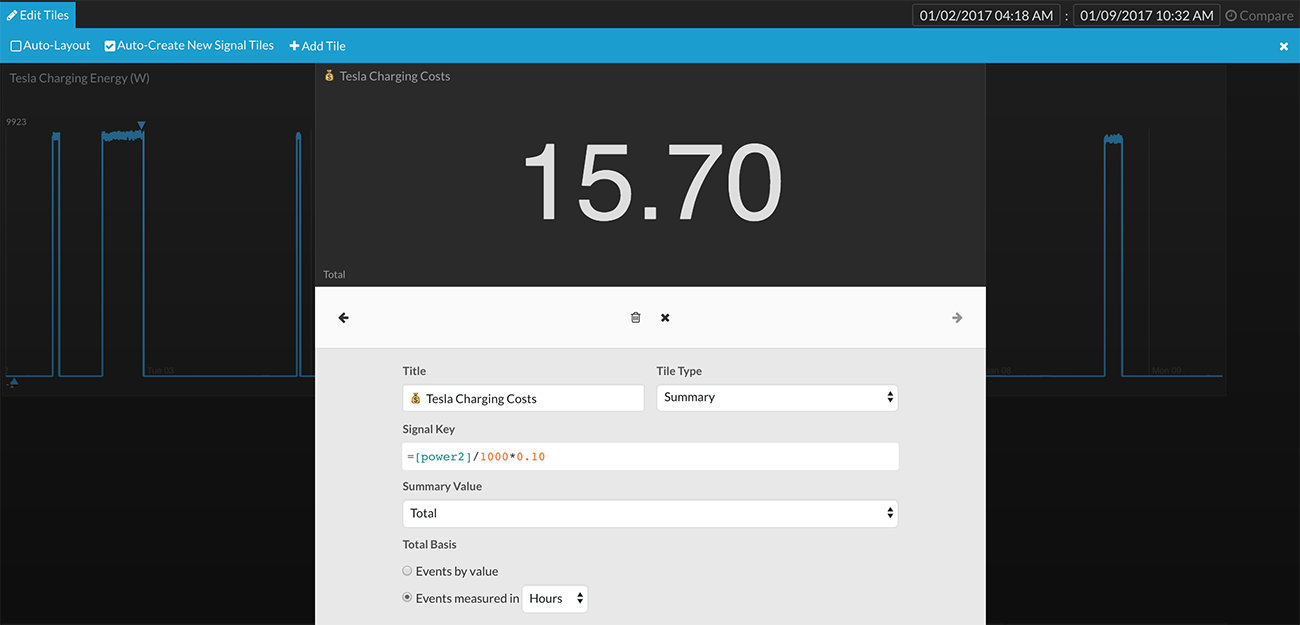
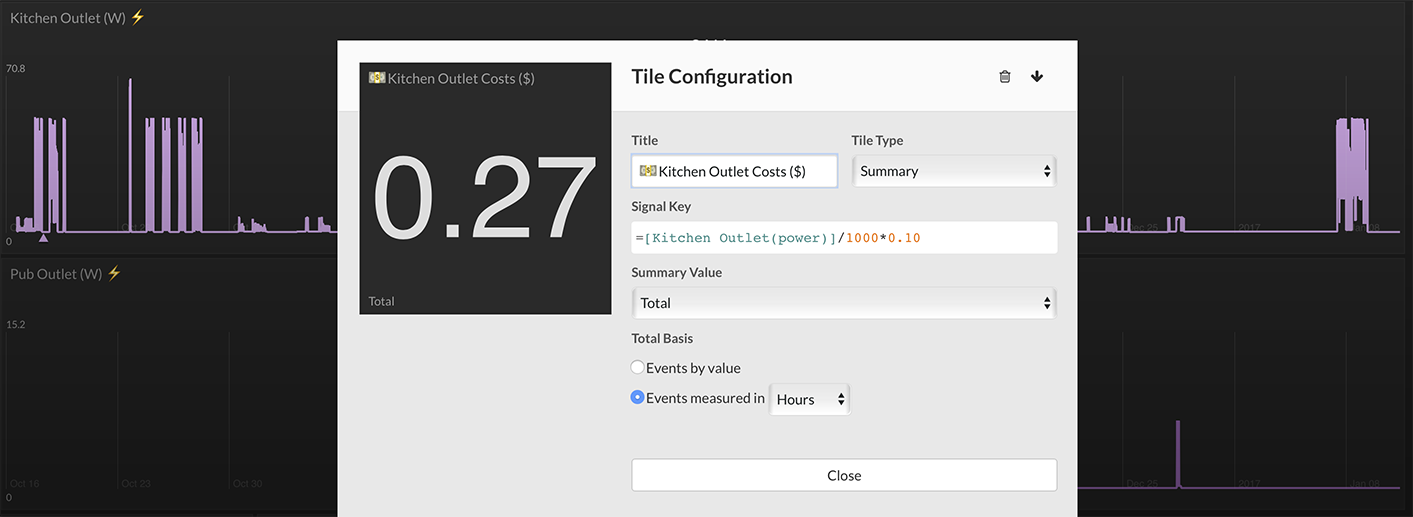
The final step is to multiply the total kWh by the your electricity rate, typically expressed as the cost per kWh. In the example above, the kWh rate is $0.10. The final expression is:
=[power2]/1000*0.10
The final computation for the total energy costs for this smart outlet is $15.70. Selecting specific time ranges in the timeline will automatically update this calculation for the energy costs in that time range.
Advantage of Method 1
The energy cost show is responsive to the time range selected in the timeline.
Disadvantage of Method 1
You cannot draw the cost as a line graph or display it in any other way than a single value. You can only use this method in Tiles and not in Waves or Lines.
Method 2
Syntax
Tile Type: Any type ... Line Graph is particularly useful.
Real-Time Expression:
=math.sum([data stream]*math.timeDelta([data stream], "hr")/1000*<cost per kWh>)
Example
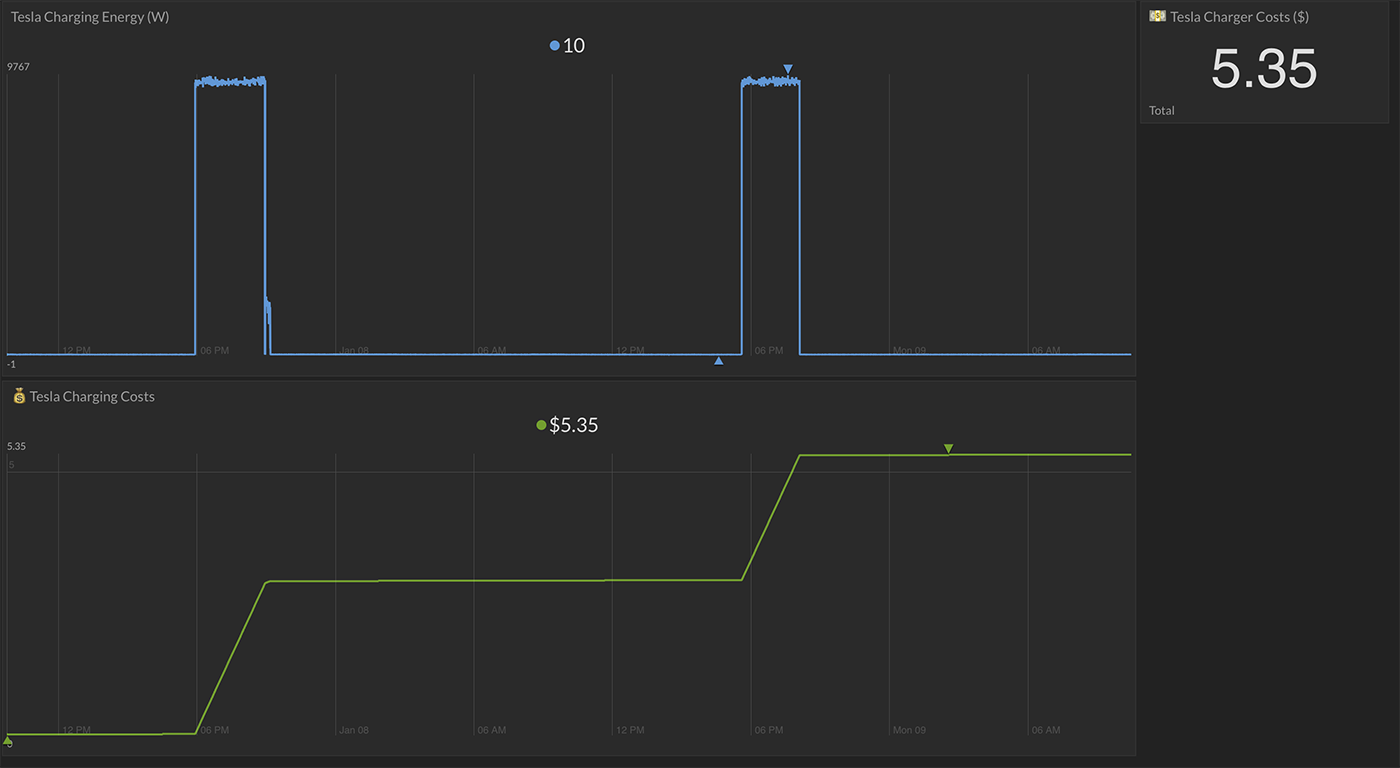
A data stream from a Tesla charger, power2, is logging the power, in Watts, consumed by charging the vehicle. This data stream needs to be converted to cost and displayed as a line graph.
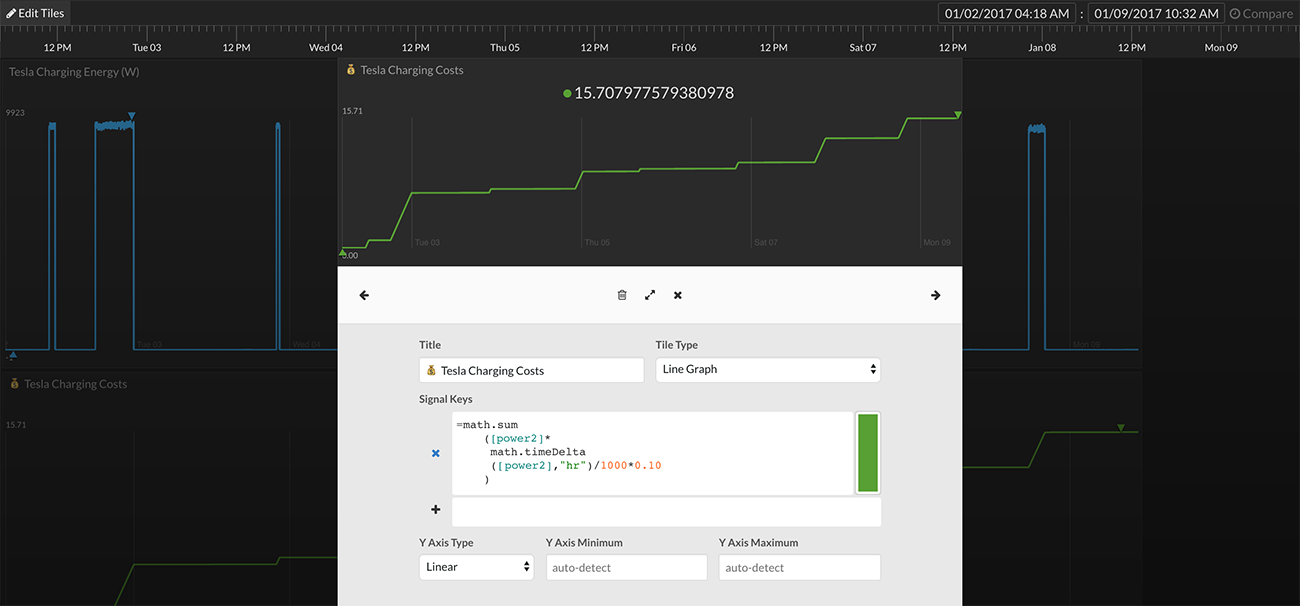
Add a tile and select the Tile Type to be Line Graph. Convert Watts to Watt-Hours (Wh) by first multiplying each data point sent by the amount of time between each data point:
=[power2]*math.timeDelta([power2],"hr")
This will create a data stream filled with values of Watts multiplied by hours. Next, perform a cumulative summation of each data point to add up the Watt-Hours from left to right:
=math.sum([power2]*math.timeDelta([power2],"hr")
Finally, divide by 1000 to get kWh and multiply by the cost per kWh (in this example, the cost per kWh is $0.10):
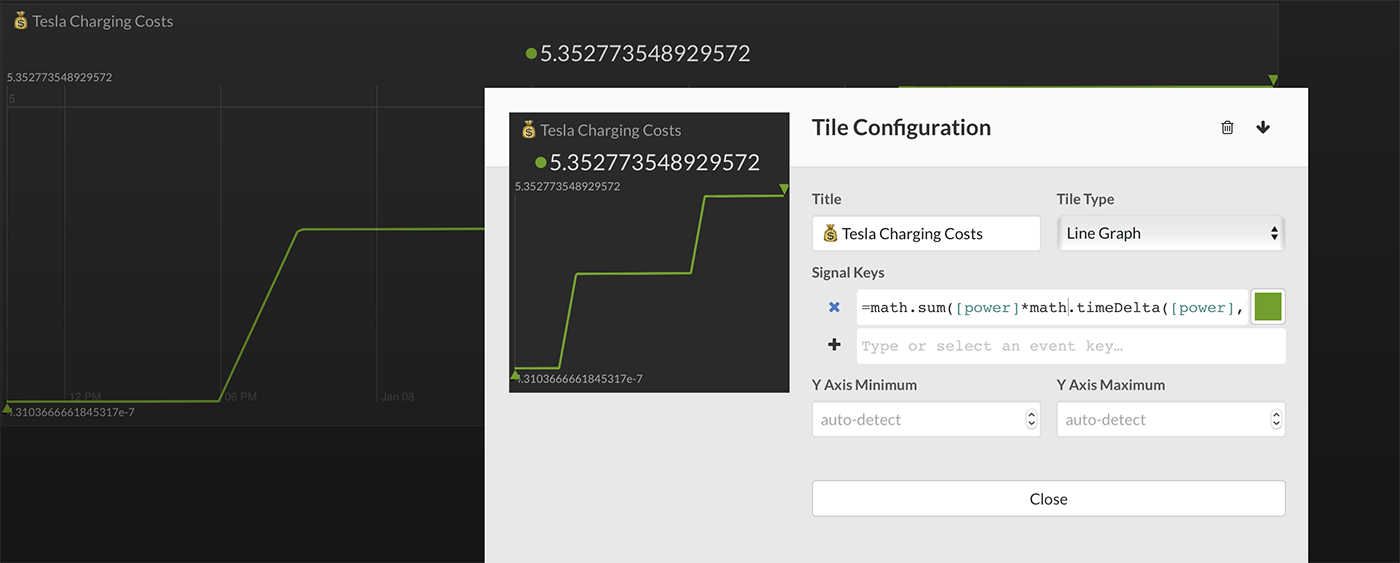
=math.sum([power2]*math.timeDelta([power2],"hr")/1000*0.10)
The result is, indeed, accumulated energy costs. However, the resulting numbers look something like this: 5.35277354892572. Let's pretty this up.
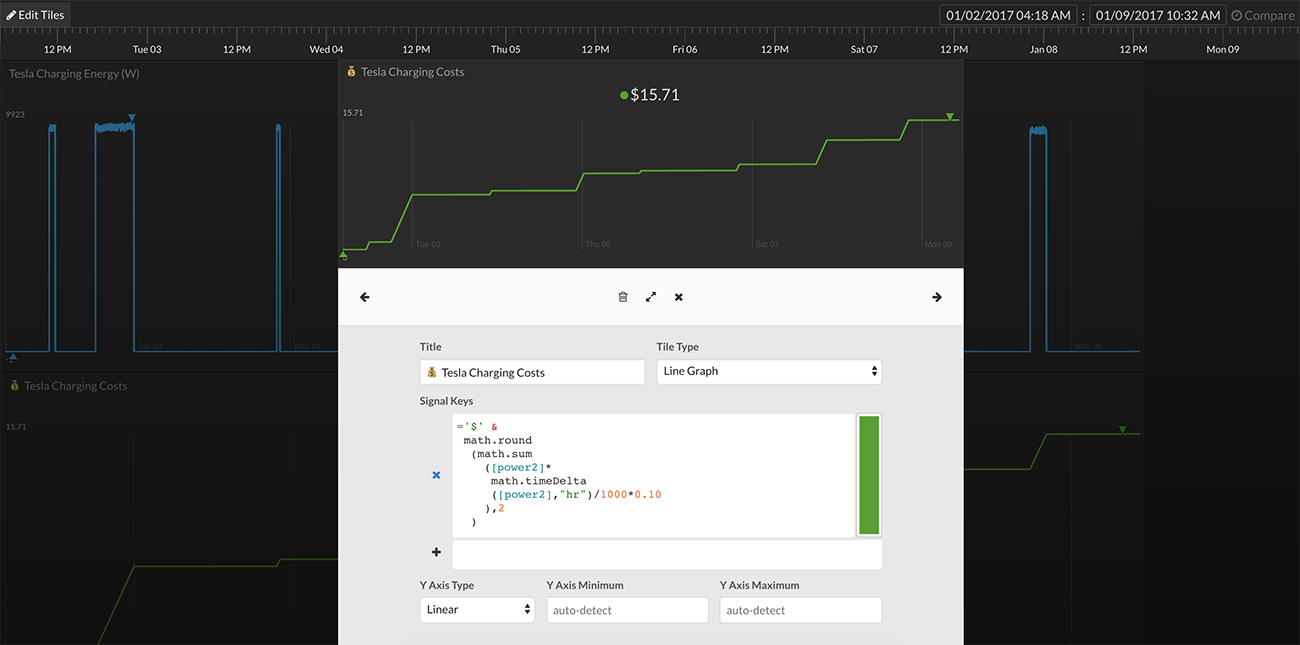
First, round the significant digits down to two to better match the way people like to see currency numbers. Use the math.round method:
=math.round(math.sum([power]*math.timeDelta([power],"hr")/1000*0.10),2)
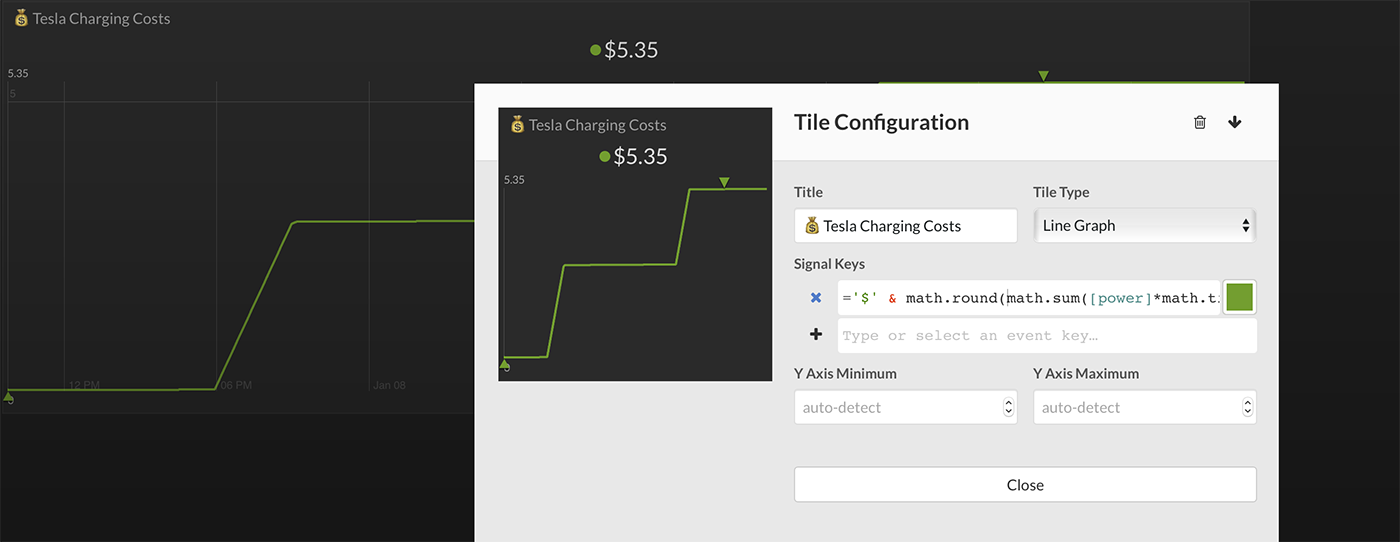
Finally, add a $ to the beginning of each data point using the concatenate operator, &:
='$' & math.round(math.sum([power]*math.timeDelta([power],"hr")/1000*0.10),2)
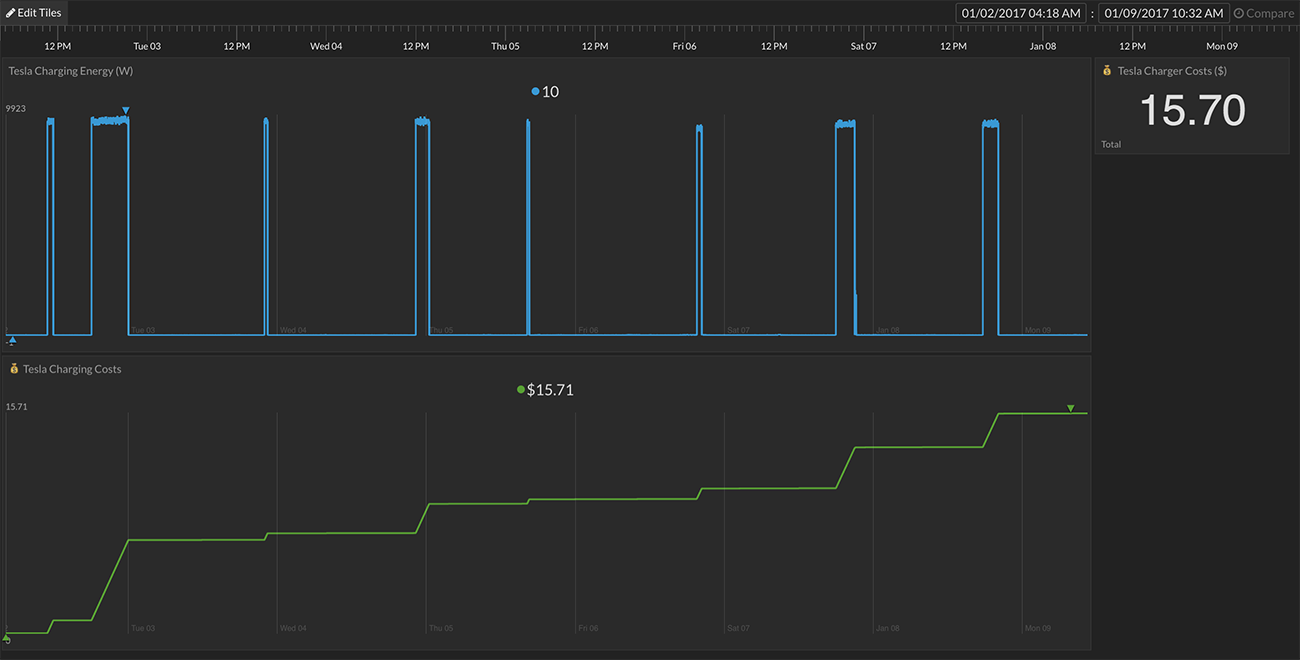
Comparing the Watts logged line graph (top) with the energy costs (bottom) shows the cost progression as energy is consumed.
Advantage of Method 2
The energy costs can be drawn as a line graph or any tile type. The costs can be shown in any app, Tiles, Waves, or Lines.
Disadvantage of Method 2
The energy costs are not responsive to the timeline.