Data View Type - Summary (Text / Last Value / Statistics)
The summary view tile displays text and text-based data/statistics.

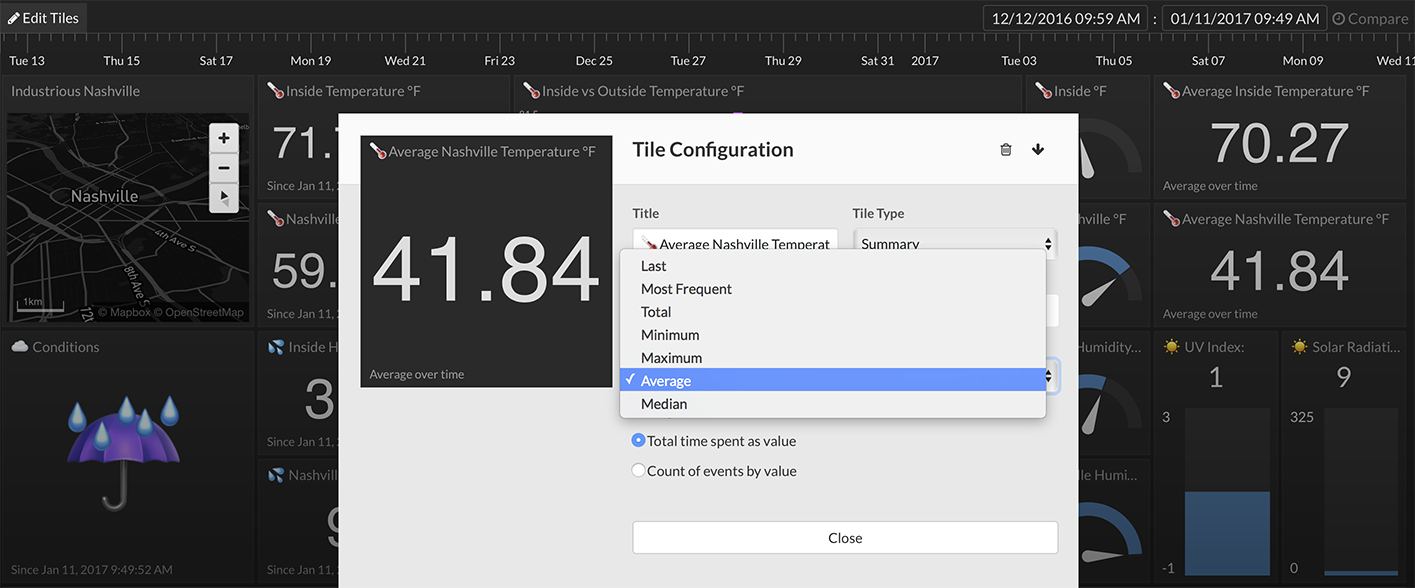
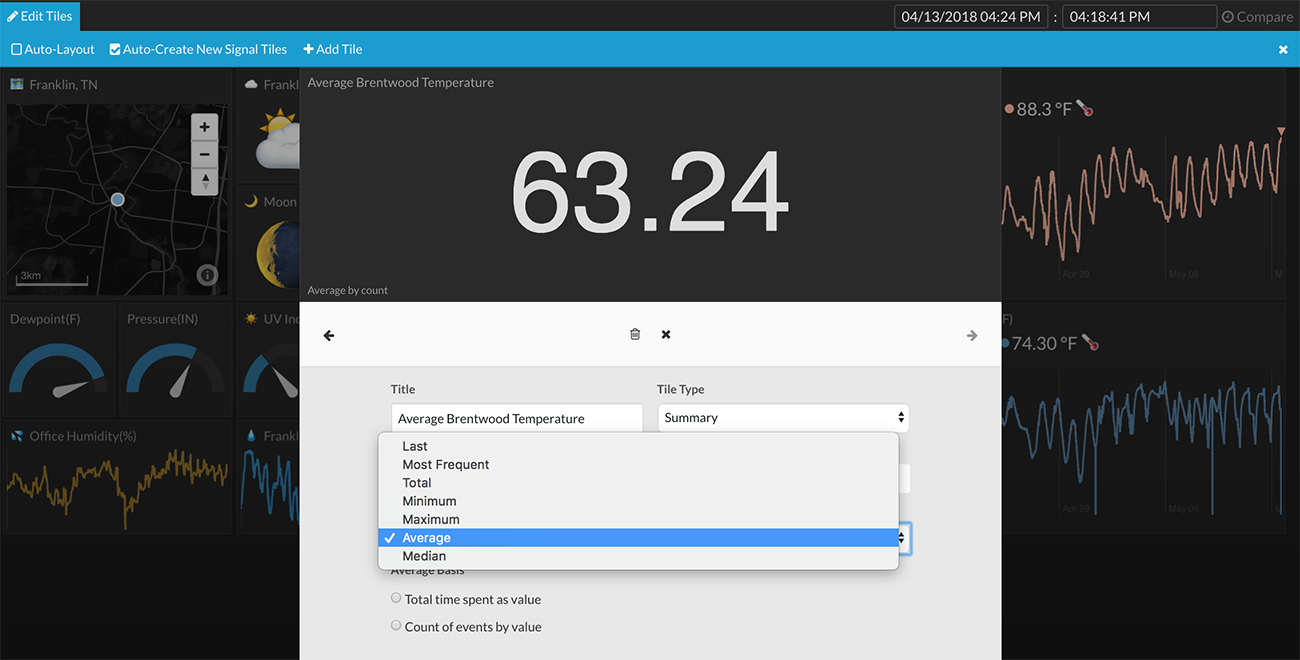
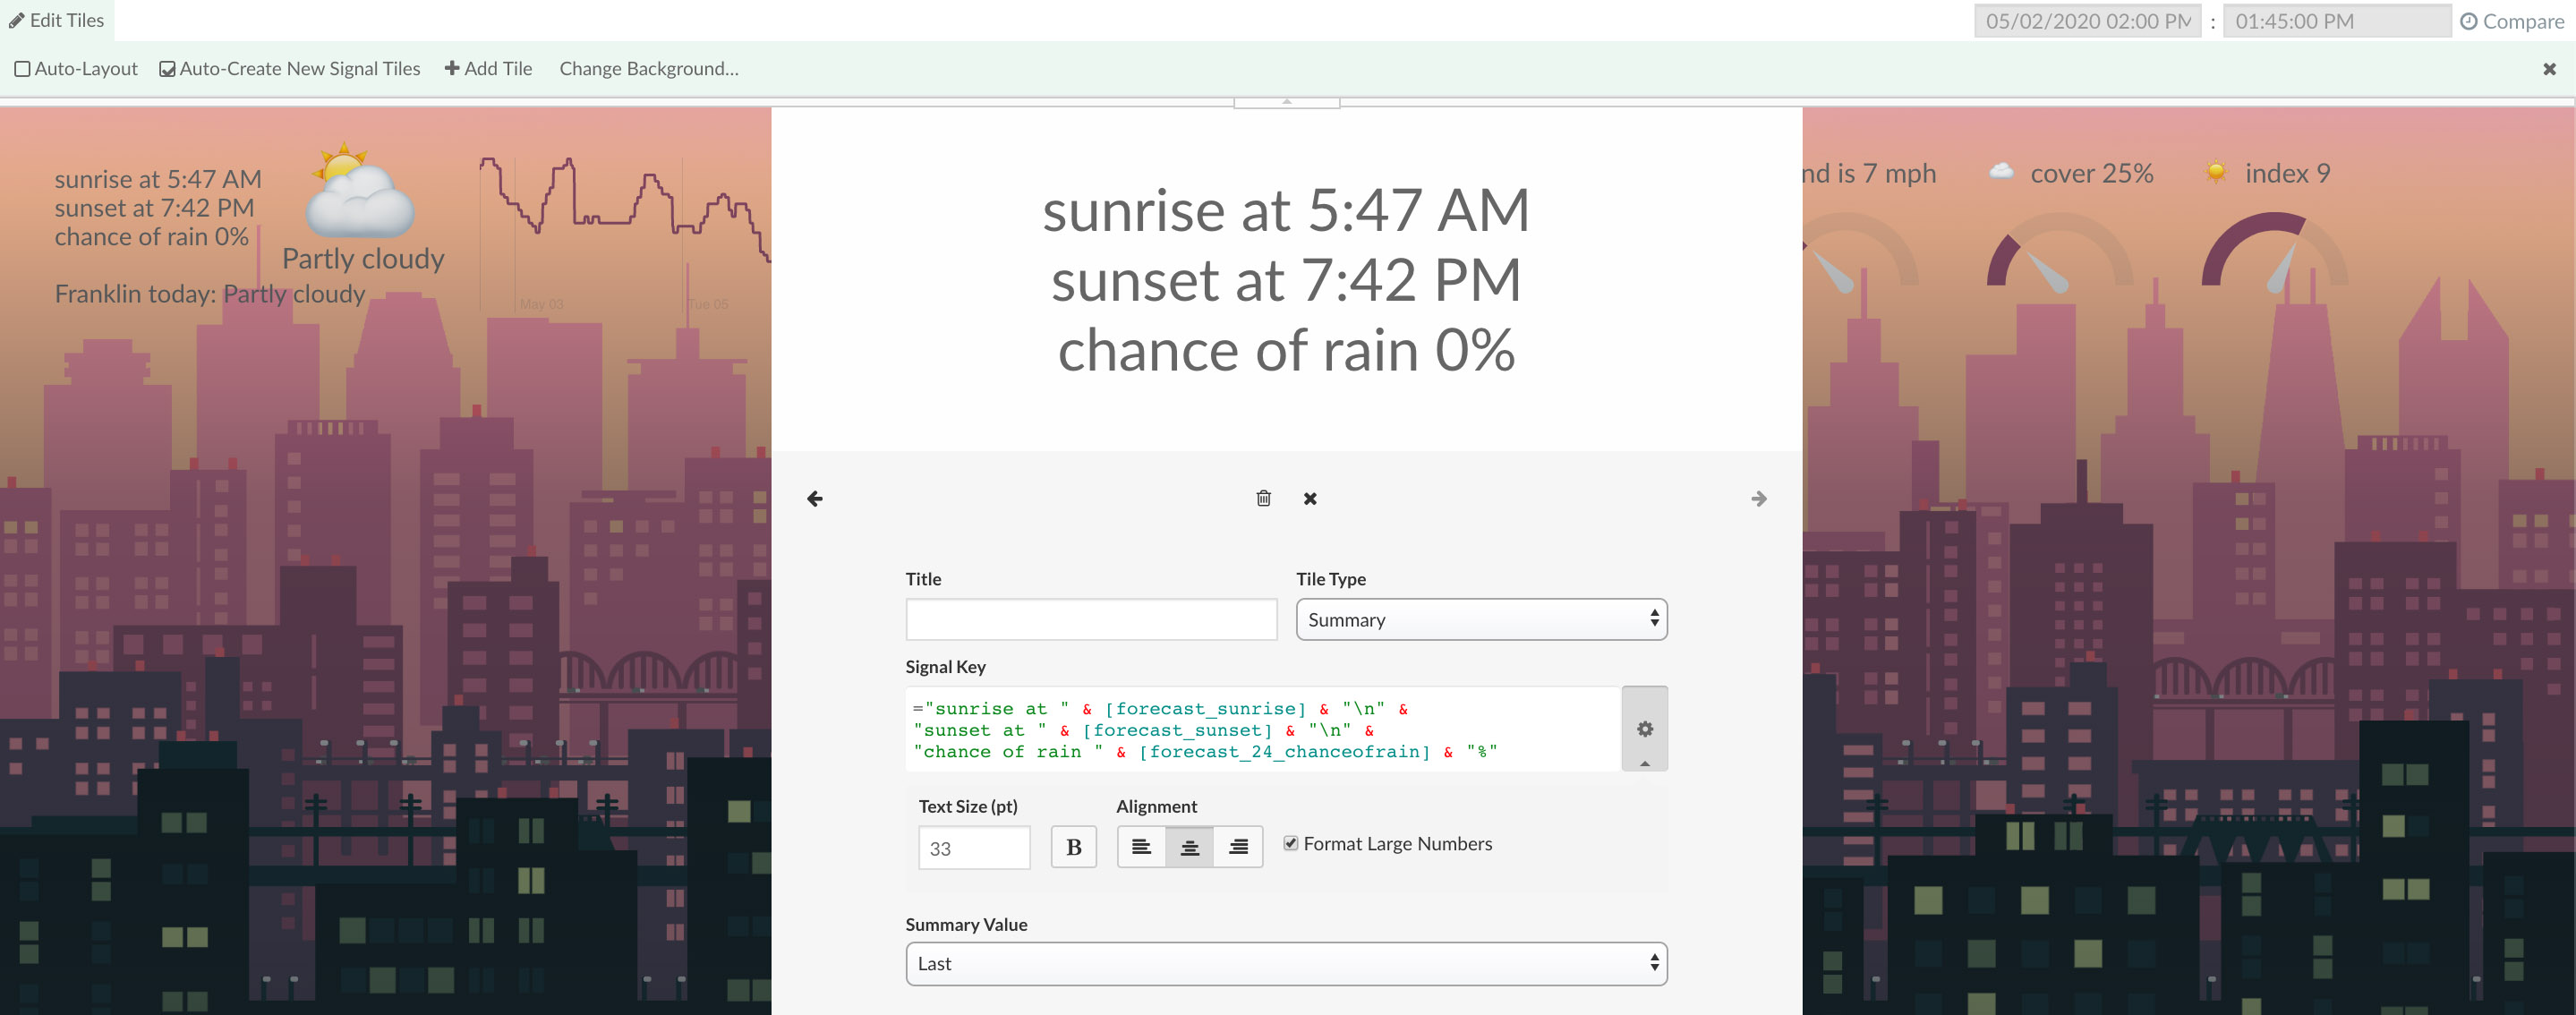
Tile Configuration
The summary tile options, including text formatting and statistical calculations, can be set in the Tile Configuration (right-click on tile -> Edit Tile). All statistics shown are calculated based on the selected timespan in the timeline. Moving the timeline selection will instantly update the calculated value shown in the summary tile.
Text Formatting Options
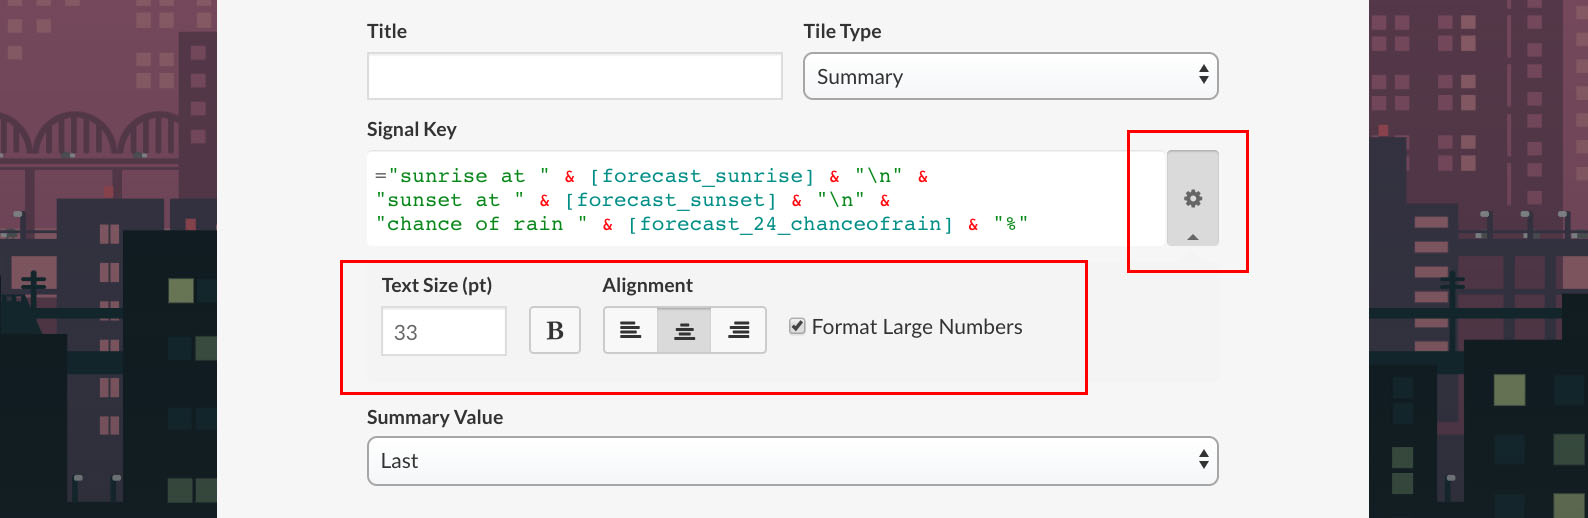
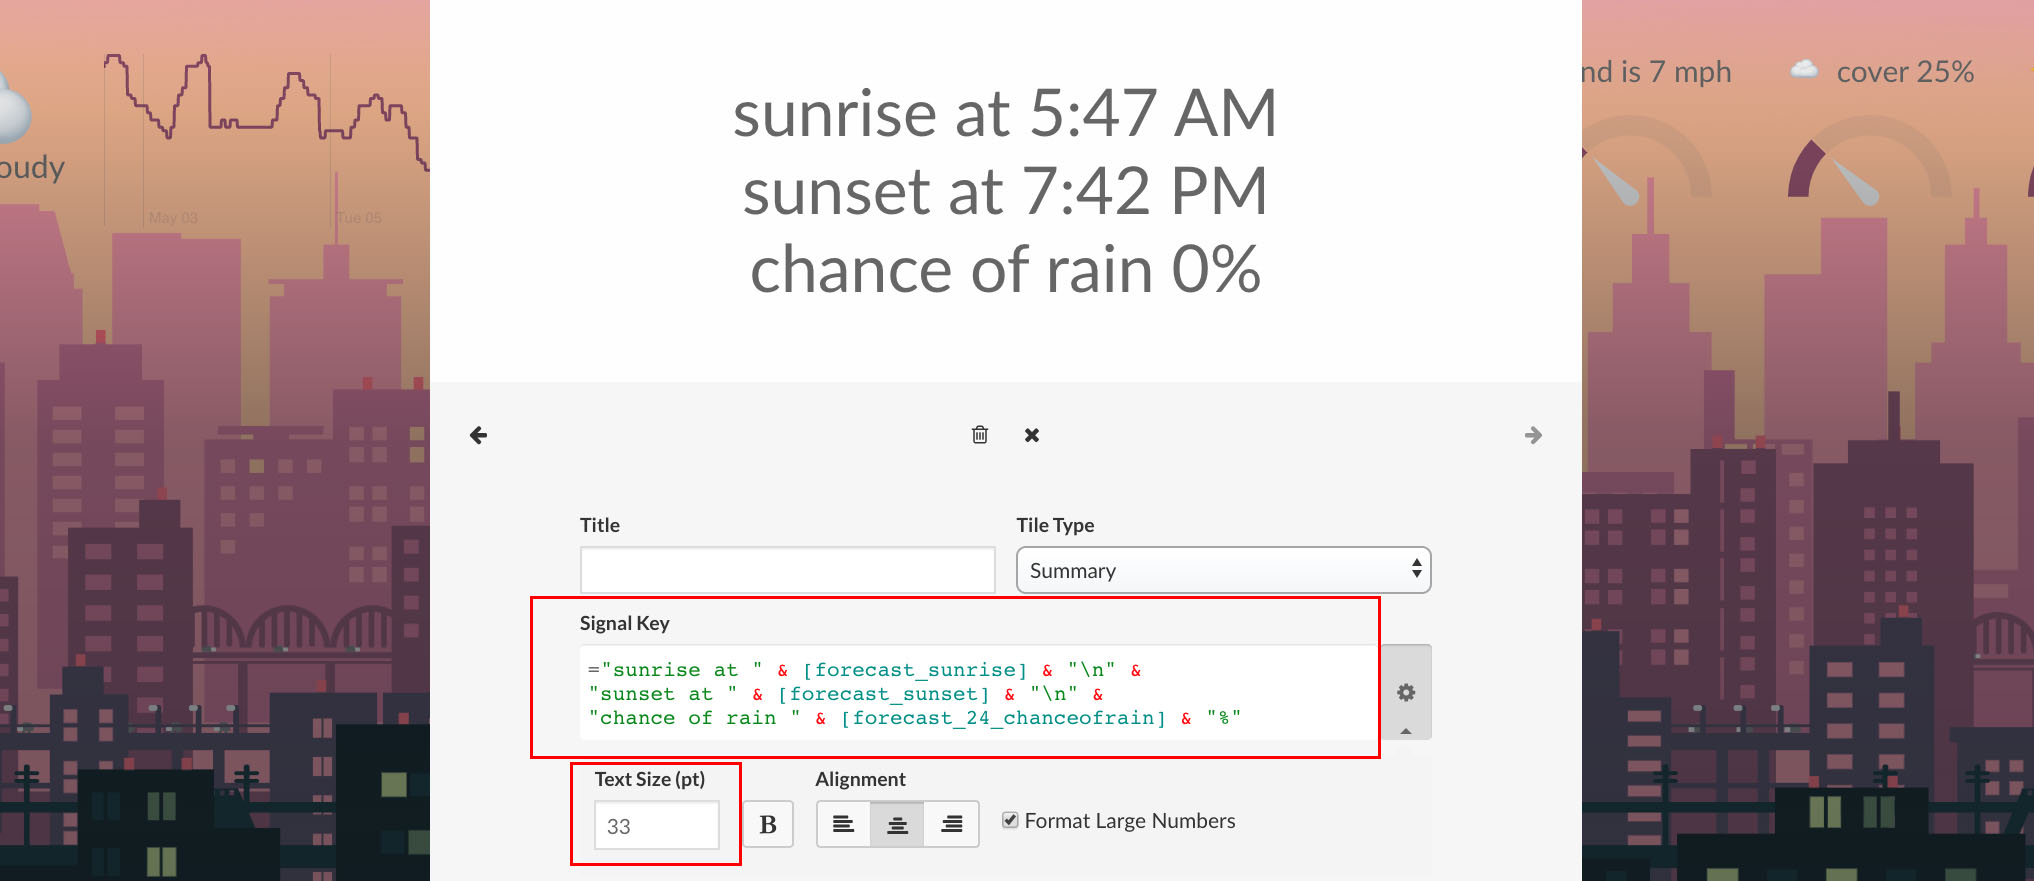
Displayed text inside the summary tile can be formatted by clicking on the advanced settings icon to the right of the Signal Key field. Formatting options include:
Text Size (pt) - Specifies the size of the text. Specifying no value will default the summary tile to fit, which will automatically size the text to fit inside the summary tile without line breaks.
Bold - When selected, makes the text bold in weight.
Alignment - Set left, center, or right alignment.
Format Large Numbers - When selected, places commas in large numbers (e.g. 1,000,000).
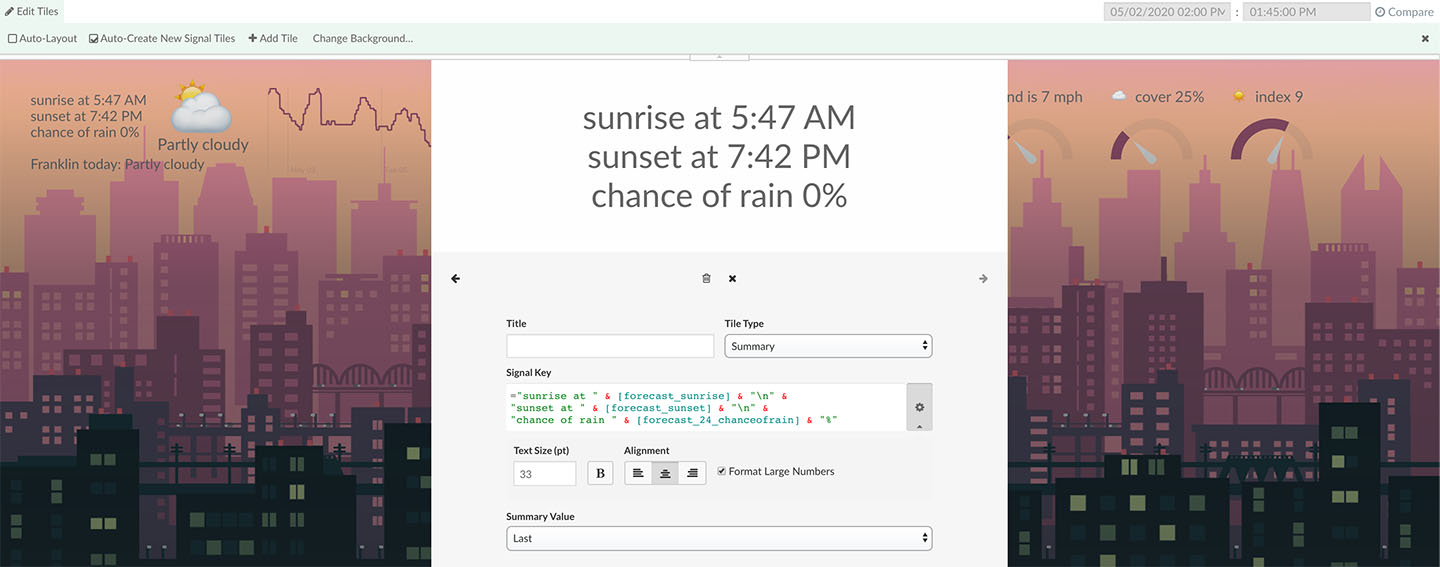
Multi-line Text

Forcing line breaks
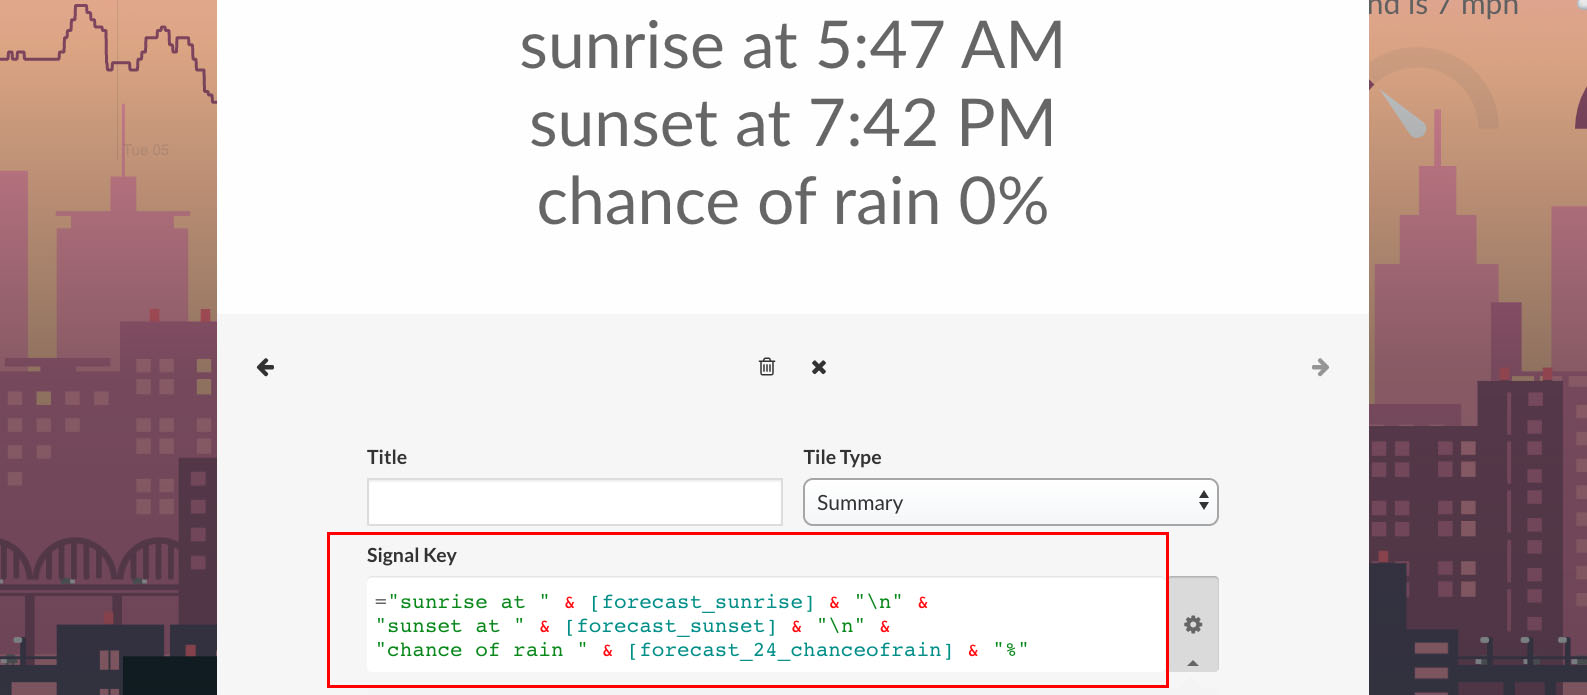
Displayed text can be multiple lines using real-time expressions (more info) and a new line character, "\n". *Text Size (pt) must be specified to something other than fit to enable line breaks.
For example,
=[signal1] & "\n" &
[signal2] & "\n" &
[signal3]
will display three values, signal1, signal2, and signal3, each on a different line within the summary tile.
*Do not forget to use the concatenate operator, &, between each value and/or string to create a legal real-time expression, especially at the end of each line break!
Text wrapping
Text will automatically wrap to new lines if Text Size (pt) is specified to be something other than fit.
Summary Type Options
| Average | Calculates numerical average in the timeline selection. Options for the numerical average calculation include total time spent as value and count of events by value. Total time spent as value takes into account time when doing the calculation. Count of events by value ignores time and only uses data points in the average calculation. |
|
Last |
Displays the most recent value in the timeline selection. This is simply the "last value" of the data stream. |
|
Max |
Displays the maximum numerical value in the timeline selection. |
|
Min |
Displays the minimum numerical value in the timeline selection. |
|
Median |
Calculates the numerical median in the timeline selection. |
|
Most Frequent |
Displays the most frequent value (mode) in the timeline selection. |
|
Total |
Calculates the summation of values in the timeline selection. Options include Events by valueand Events measured in <time unit>. Events by value simply adds up each value. Events measured in <time unit> adds up each value multiplied by the amount of time spent at each value (example: compute Watt-hours from Watts). |
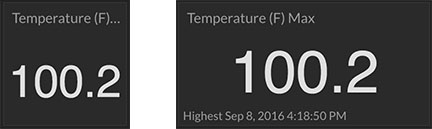
Size/Dimension Options

A minimum sized width+height tile will not show context footer text. Any other size tile will show context footer text that provides additional information about the displayed statistic. For example, the max summary view will show context footer text that displays the date/time of the max value detected.
Hover
There are no hover capabilities to the summary tile at this time.
Color
There are no color options in the summary tile at this time.