New Feature Releases:
August 21, 2017
New Mobile Experience
The mobile experience in Tiles has changed to show more tiles on the screen and give you one-click access to expand any tile to nearly full-screen. You can read about all mobile options here.
August 21, 2017
Enhanced Tile Edit
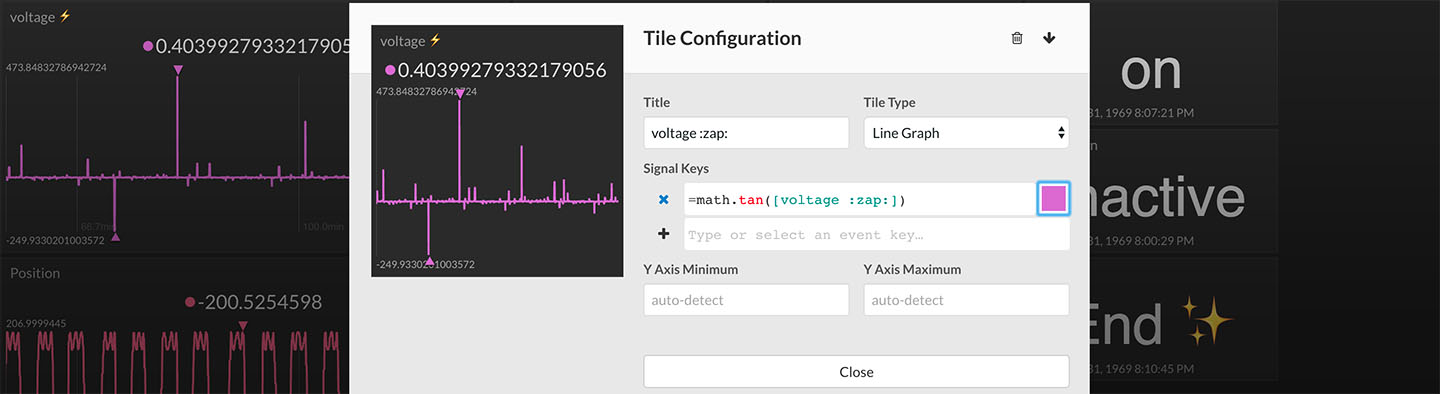
The edit tile configuration UI just got a facelift. The preview tile is larger and now covers the width of the popup dialog box. You can cycle to the next/previous tile using the left/right arrow icons or keys. You can also expand the preview to nearly full screen using the expand icon. You can see a quick demo of cycling between tiles in edit mode here.
August 21, 2017
Multi-line Expression Editor
Expressions can be now be multiple lines for increased readability. Simply hit the Return key to create a new line. White-space characters (newlines, tabs, spaces) are ignored for all expressions. The edit field will increase in height with each new line. More info ...
August 21, 2017
New Real-Time Expression Capability -> Constant Assignment
You can now assign an empty dataset to a constant. This allows you to create expressions that search for errors and display an error message if found or a default message if not found. Or, you can simply create a tile that displays your favorite emoji all of the time (e.g. ="😛"). Check out an example of creating an error checking tile here.
July 3, 2017
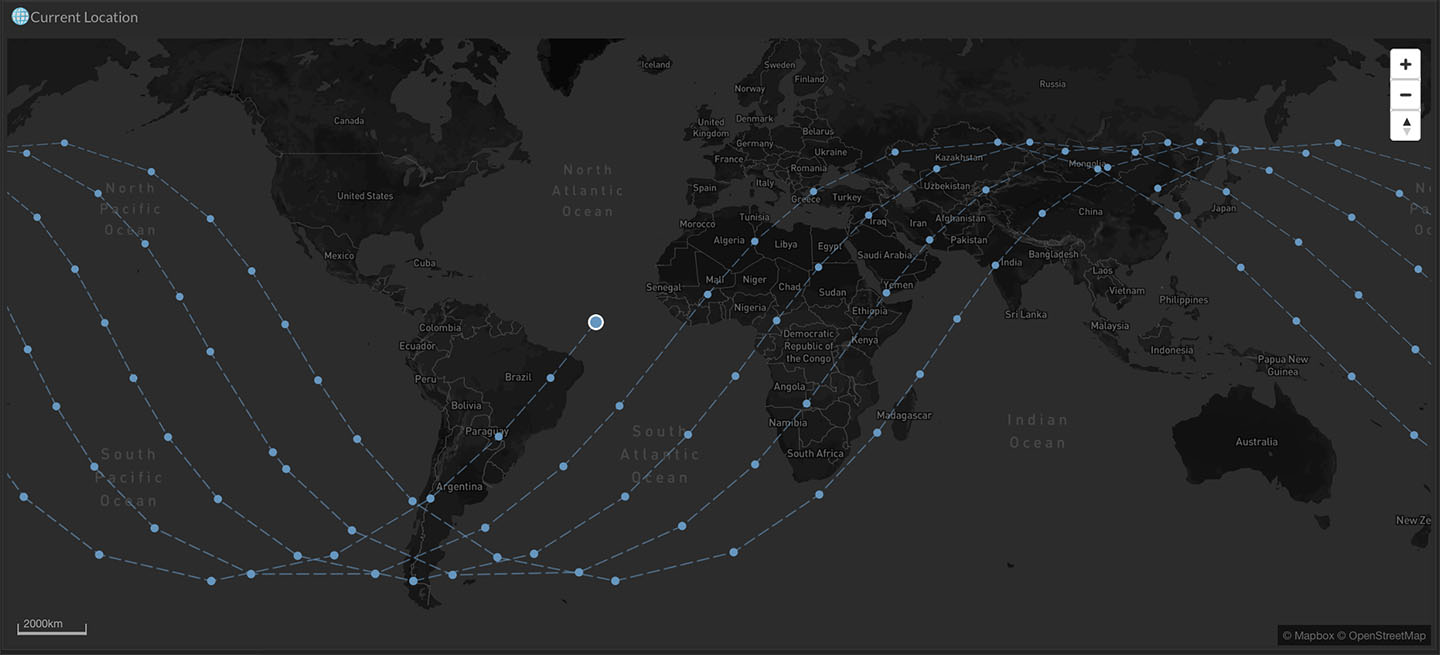
Most Recent Location Map Highlight
You can easily find the most recent location of a data stream as it is now highlighted in the map view of Tiles. Read more about the map view and its capabilities here.
July 3, 2017
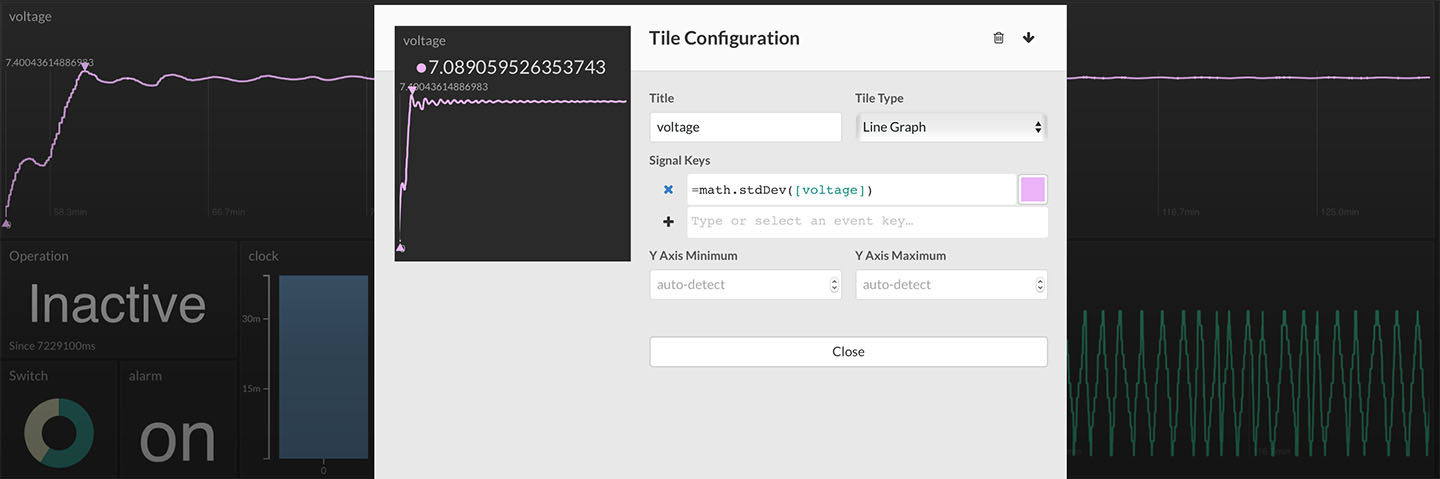
New Expression Operators -> ^ (exponential), math.stdDev, math.variance
You can now use three new operators/methods in your real-time expressions. The exponential operator, ^, is now supported (e.g. 3^2 = 9). math.variance computes the cumulative variance of a numerical data stream (equivalent to =math.mean([data stream]^2) - math.mean([data stream])^2). math.stdDev computes the cumulative standard deviation of a numerical data stream (equivalent to =math.sqrt(math.variance([data stream])). Read more about all of the real-time expression operators and methods here.
June 14, 2017
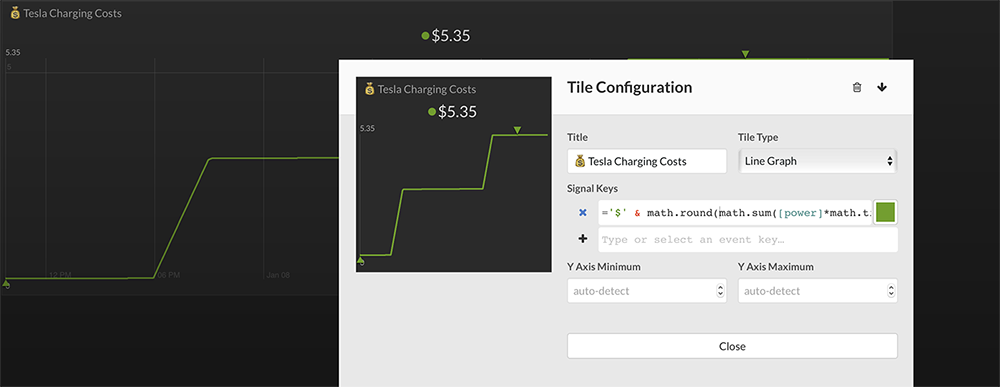
New Expression Operators -> math.sum, math.mean, math.sqrt
You can now create real-time expressions that compute the cumulative sum (math.sum) or the cumulative average (math.mean) of a numerical data stream. When combined with math.timeDelta, you have another way to convert Watts to energy costs (see example). There is also now a square root operator (math.sqrt). Read more about all of the real-time expression operators and methods here.
June 9, 2017
Data Markers!
You can now add notes to specific time segments for a data bucket in Tiles using Data Markers. Simply select a timespan using the timeline, right-click, and select Add Marker from the drop-down menu. Type your note and hit Enter to save. You can view a Data Marker by clicking on the marker highlight in the timeline and even cycle through each Data Marker using the arrow keys. Read more about Data Markers here.
May 24, 2017
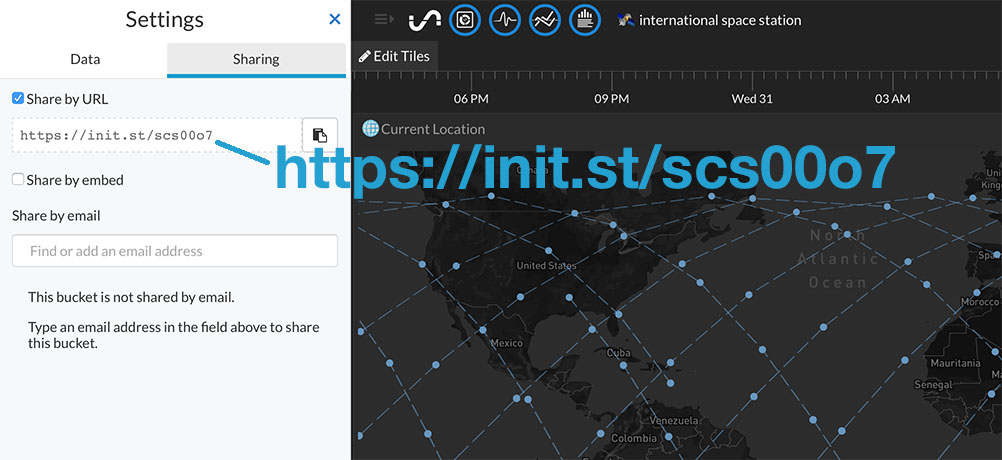
New Short URLs for Public Shares
URLs generated for publicly shared data buckets are now short URLs. For example, https://init.st/scs00o7. You can read about data sharing options here.
May 24, 2017
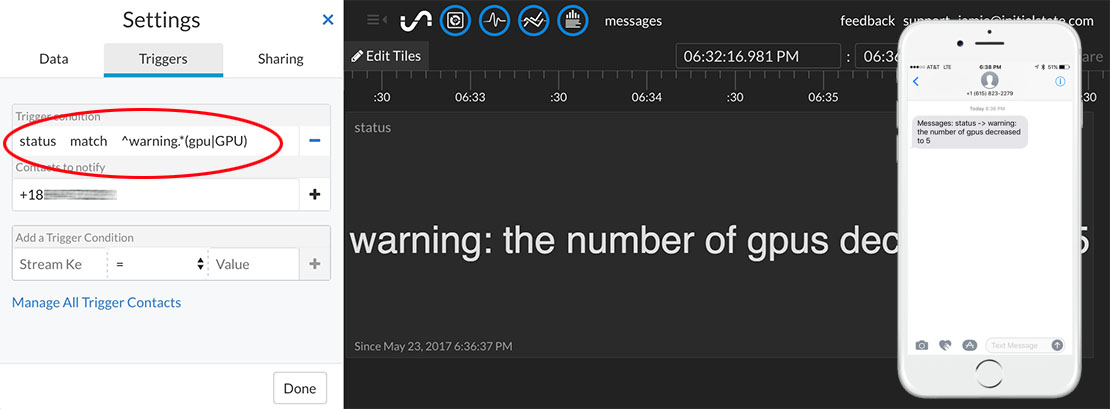
New Trigger Operator -> Regular Expression Match
You can now trigger a notification if a data stream's value matches a defined regular expression. The match operator supports regular expressions, allowing you to specify complex pattern matches. You can test out your regular expressions before inserting them into your active trigger using tools such as www.regexpal.com. You can read about all supported trigger operators here.
May 18, 2017
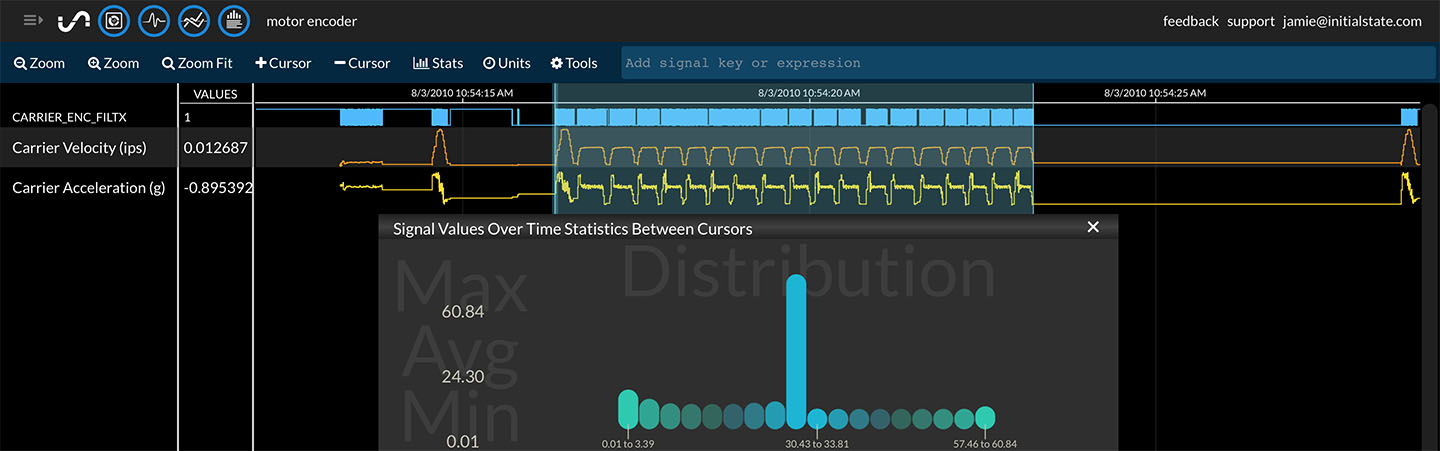
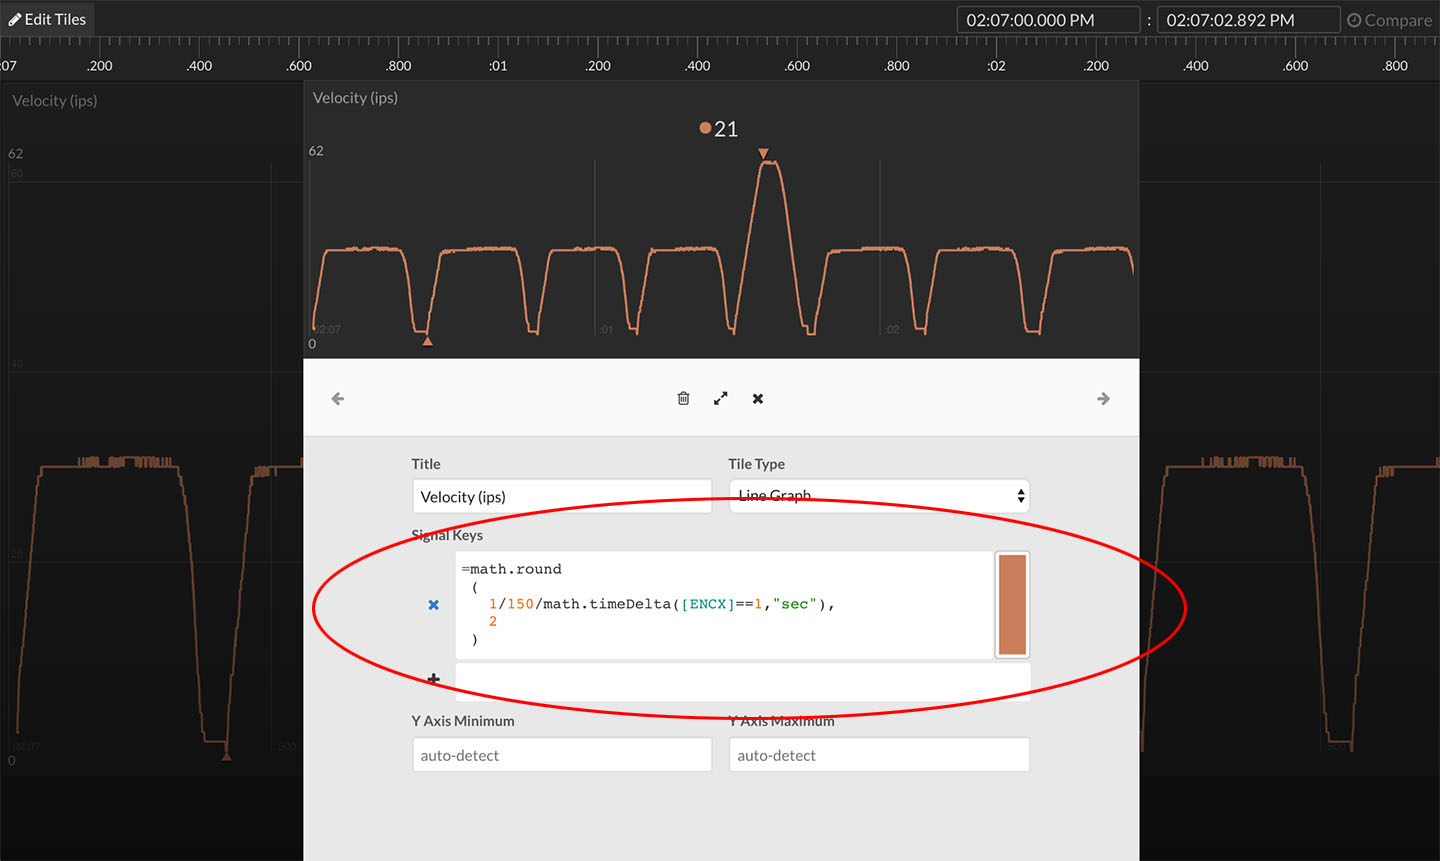
New Expression Operators -> math.delta, math.timeDelta, math.timeDerivative
You can now use real-time expressions to compute the difference between consecutive values in a data stream using the new math.delta method. You can also compute the time difference between consecutive values using the new math.timeDelta method. You can compute the change in value / change in time (a.k.a. derivative) using the new math.timeDerivative method. Check out an example of using these new expressions to compute the velocity and acceleration values from a single, binary motor encoder signal. You can read about all supported expression operators and methods here.
May 9, 2017
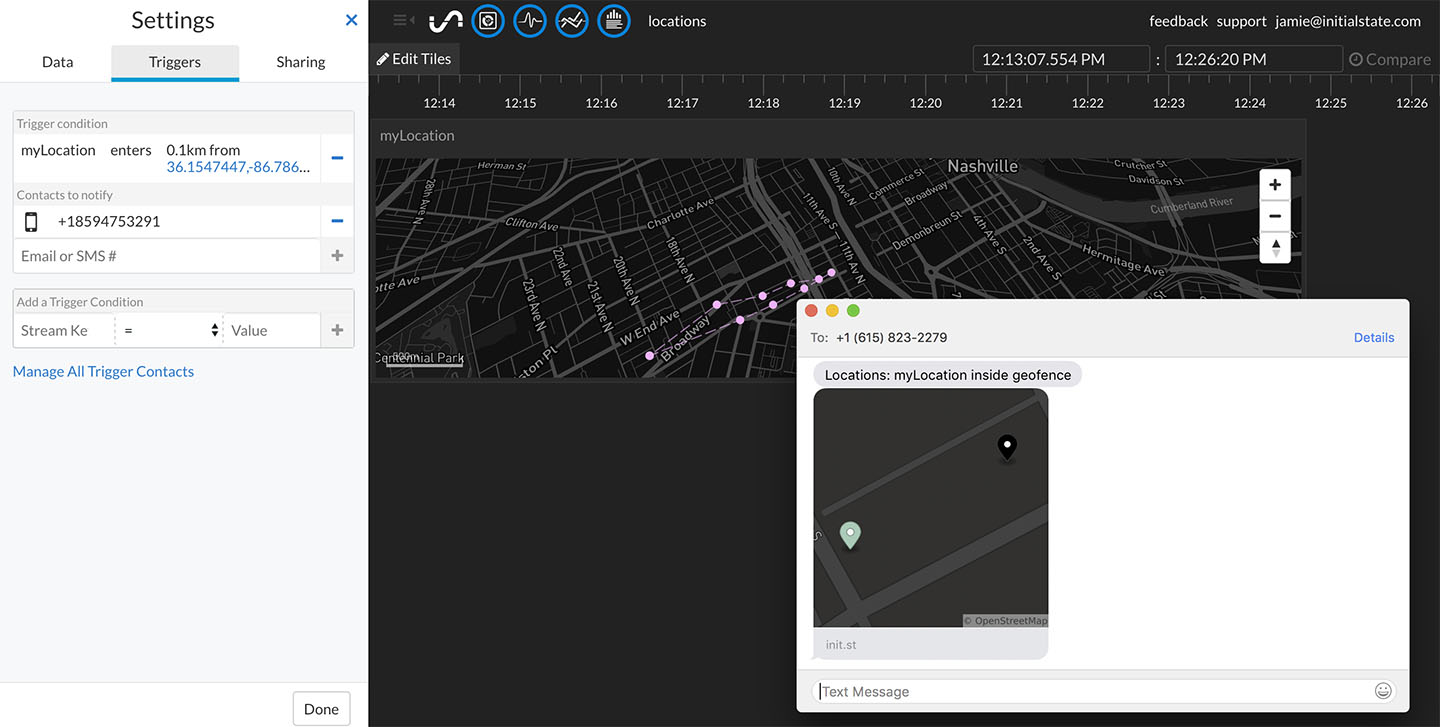
New Trigger Operators -> Geofencing and Increases/Decreases
You can now trigger a SMS alert or email message if a data stream increases or decreases by a certain amount. You can also setup a geofence and trigger an alert if an asset moves in or out of the geofence. Check out an example of how easy it is to setup a geofence trigger or check out all supported trigger operators.
Apr 4, 2017
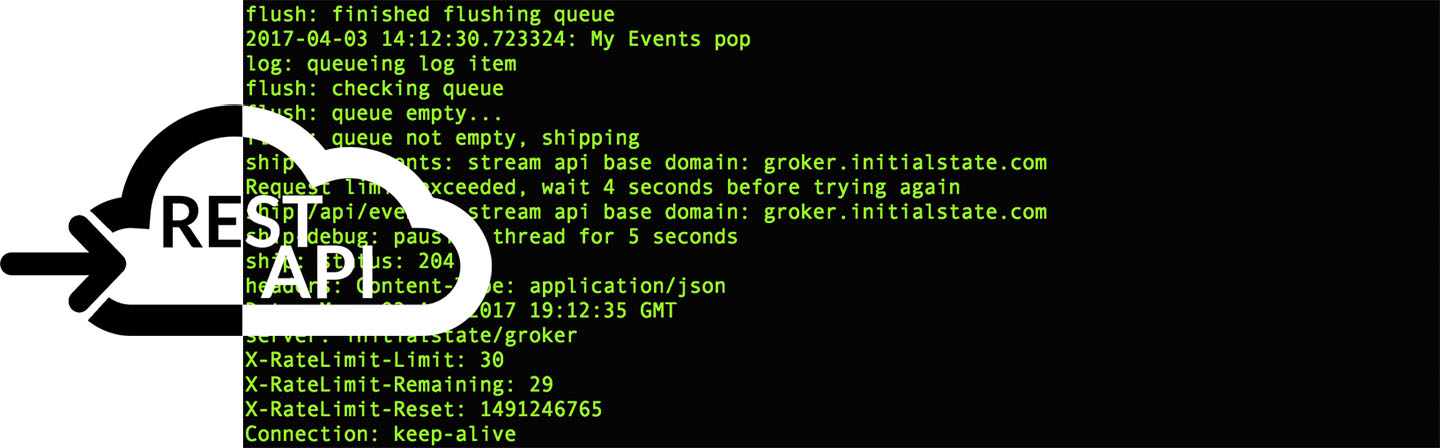
API Rate Limit Response + Smarter Python Streamer
The API will now respond with your current rate limit within the response headers of each call when streaming data into your account. This information will assist you when troubleshooting data loss related to excessive API calls. The headers that will be returned include:
The ISStreamer Python module has been updated to version 0.2.2. This update utilizes the new returned rate limit headers to automatically adjust script execution to ensure there is no data loss due to excessive API calls. Read more about API rate limits and the new response headers ...
Mar 24, 2017
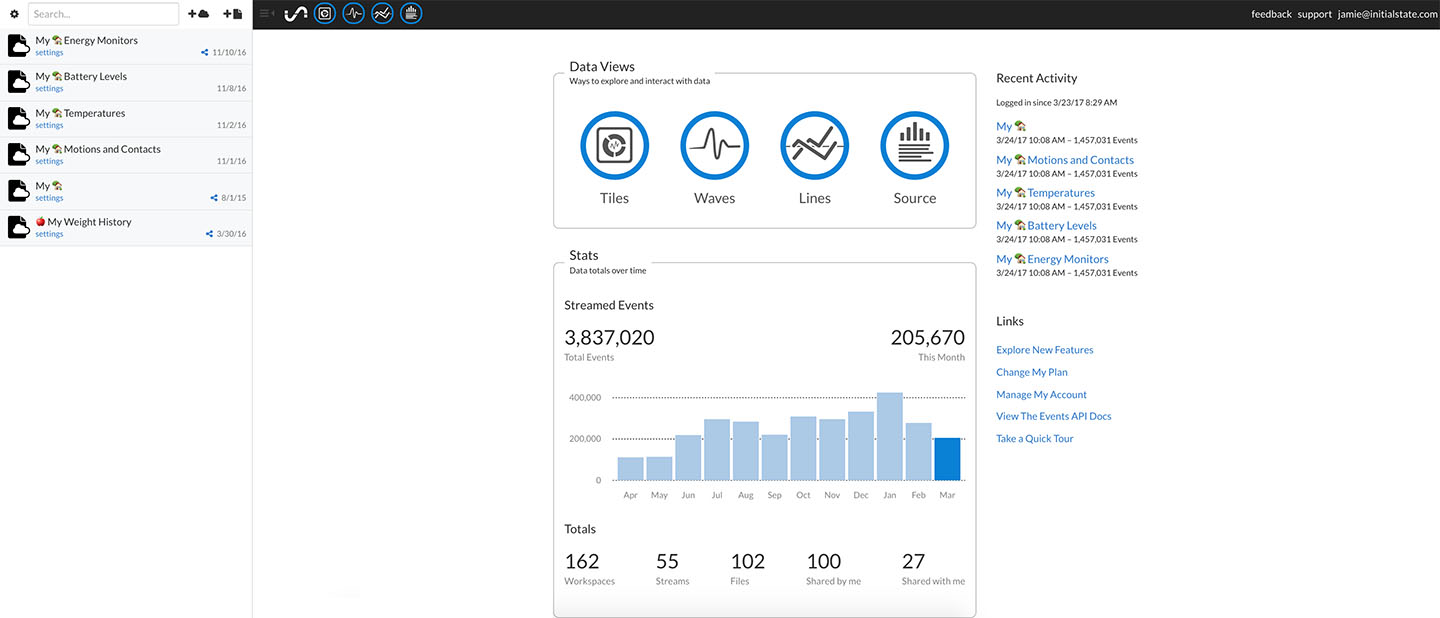
New Launch Page
You will see a new launch page the next time you log in to your Initial State account. You will find a new statistics section showing you how many events you have streamed every month, how many workspaces (data bucket views), uploaded files, shares, and more.
Mar 15, 2017
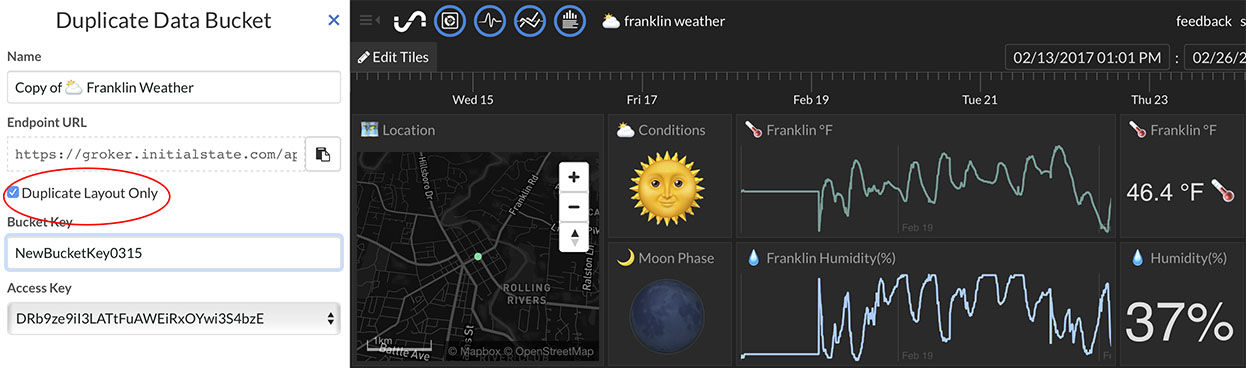
Duplicate a Tiles Layout to Another Dataset
You can now easily duplicate that awesome Tiles dashboard layout that you worked so hard to perfect to another dataset. Click on the "settings" link underneath the bucket name on the bucket shelf, click on the "Duplicate" button, select the "Duplicate Layout Only" checkbox, and type in the target bucket key. This will create a new view for the specified data bucket using a different data bucket view layout (tile sizes, names, view types, real-time expressions, etc). Read more ....
Feb 7, 2017
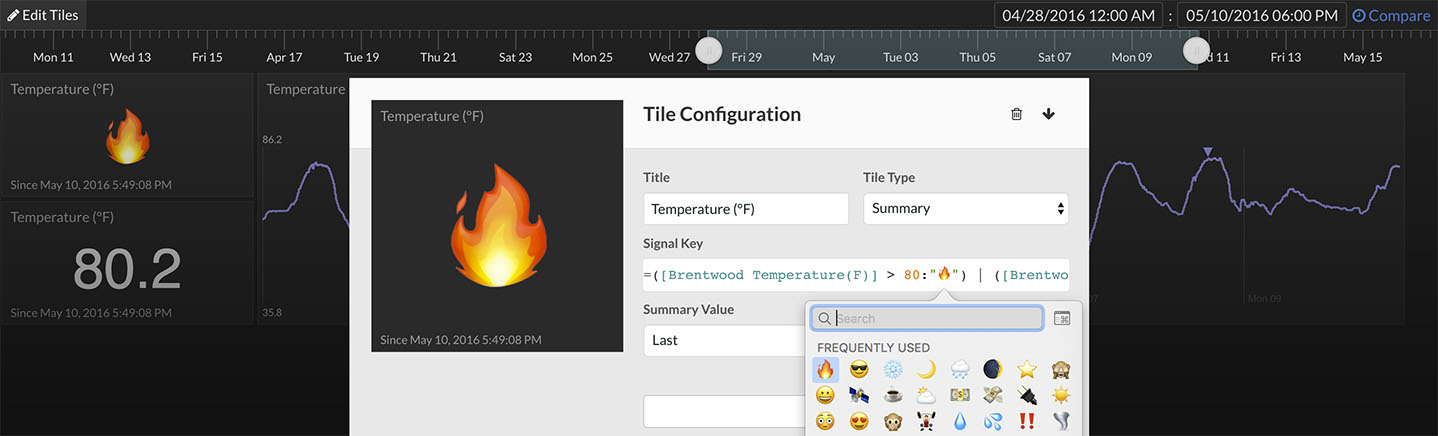
Map Operator
The map operator, :, has been added to the list of supported operators available in real-time expressions. This operator allows you to map specific values or value ranges in a data stream to constants or even values from another data stream. For example, you can map and display an emoji such as 🔥 to any value over 80 in a temperature stream. Check out a detailed example of how to use the map operator here.
Feb 7, 2017
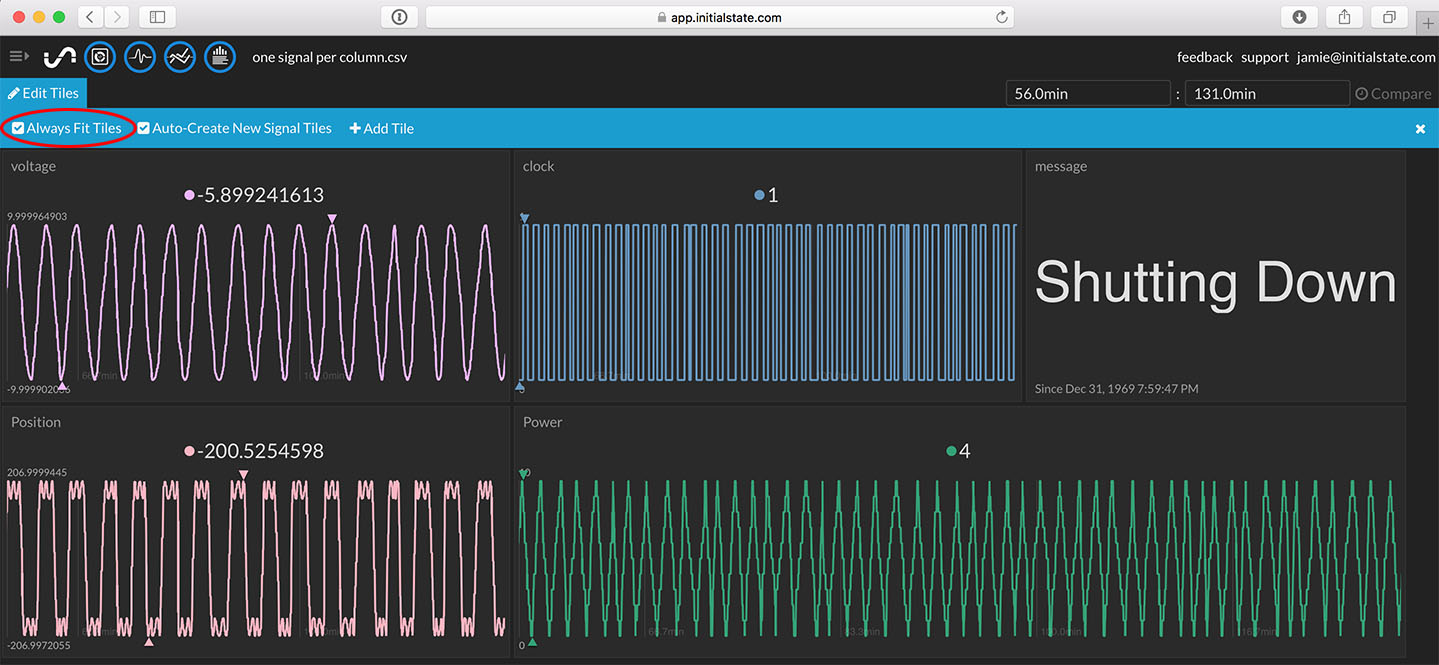
Smarter Tiles Auto-Layout
Using the "Always Fit Tiles" auto-layout option just got a lot smarter. Tiles are automatically sized based on the tile type to better fit the width of your dashboard. For example, line graphs are now automatically drawn as wide rectangles instead of small squares for a more optimal data view.
Feb 7, 2017
Local Caching for Fast Loads
Datasets are now cached locally in Chrome and Firefox for blazing fast load times. Only bucket views that do not use the "Show Events Since" option are cached. Logging out of your account will automatically clear all local caches.
Jan 12, 2017
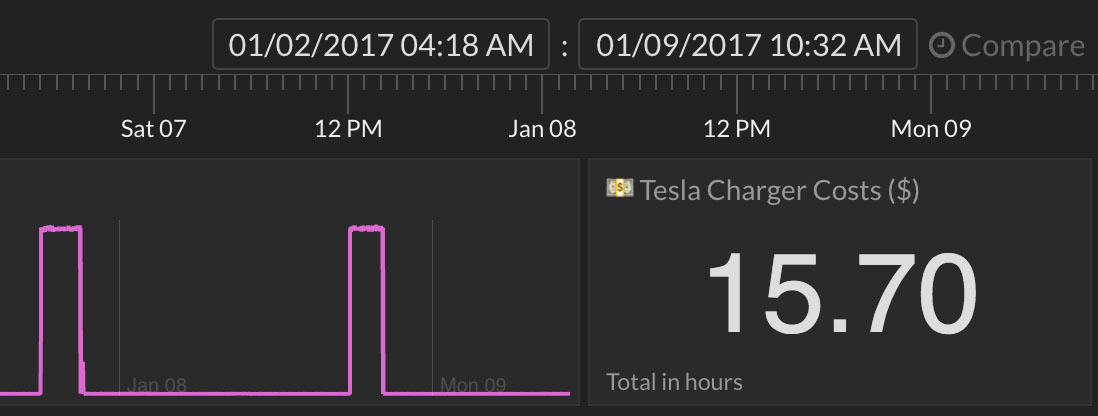
Compute Energy Costs in Real-Time
A new Summary (statistics) tile type is now available - Total. This tile type gives you the ability to add up the total of each value in a data stream for a selected time range. There is also an option to add up each value multiplied by the time spent as each value. This option gives you a super easy way to convert Watts (W) to Watt-Hours (Wh). You can use real-time expressions to complete the conversion of Watts to energy costs. Check out a detailed example here.
Jan 12, 2017
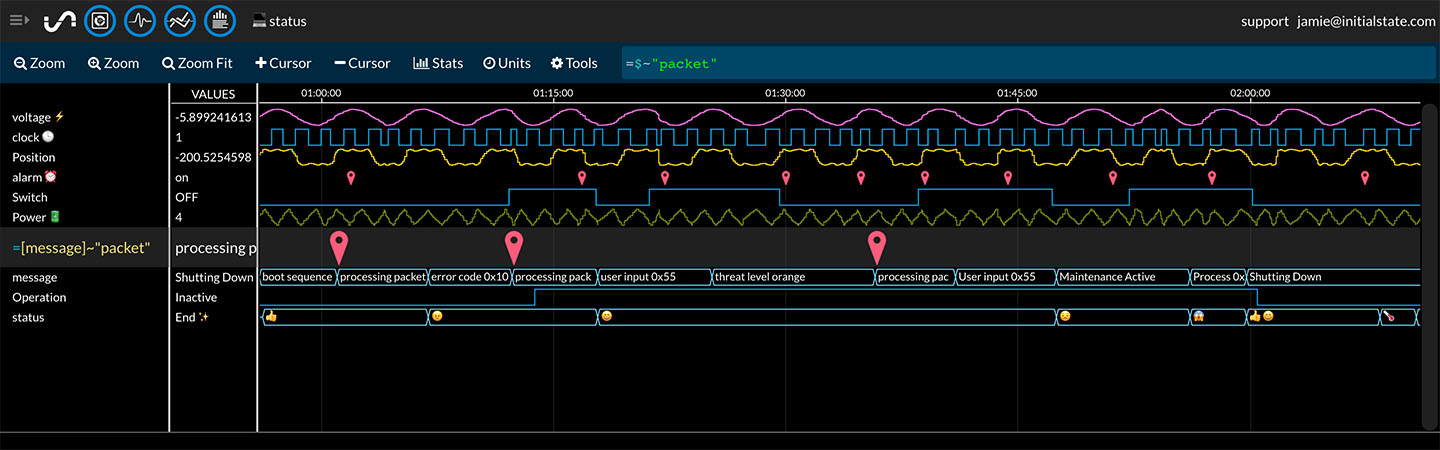
Quickly Search Inside a Data Stream
You can now search for specific values, partial matches, and ranges inside of a data stream in Waves using real-time expressions. Select a data stream and use the shortcut, $, to reference that selection in your expression instead of typing out the full name. You can use the new operator, ~, to search for a partial match. For example, you can search for all occurrences of the word "error" in a signal by first highlighting that signal and using the expression, =$~"error". You can find more examples here.
Jan 12, 2017
More Math Options
Sine, cosine, tangent, and Pi have been added to the math package in real-time expressions. A list of all operators can be found here.
Dec 9, 2016
Smart Gridlines in Waves and Lines
The gridlines in both Waves and Lines are now drawn on "neat" axis intervals. The number and location of gridlines are dynamic based on the size of your window and the data contained in the current zoom level.
Dec 9, 2016
Mouse Wheel Pan/Zoom in Waves and Lines
You can now use the mouse wheel to navigate through data in both Waves and Lines. You can pan through your data using just the mouse wheel. While holding down the CTRL key, the mouse wheel will zoom in/out of data.
Nov 10, 2016
Create Multiple Dashboards from One Data Bucket
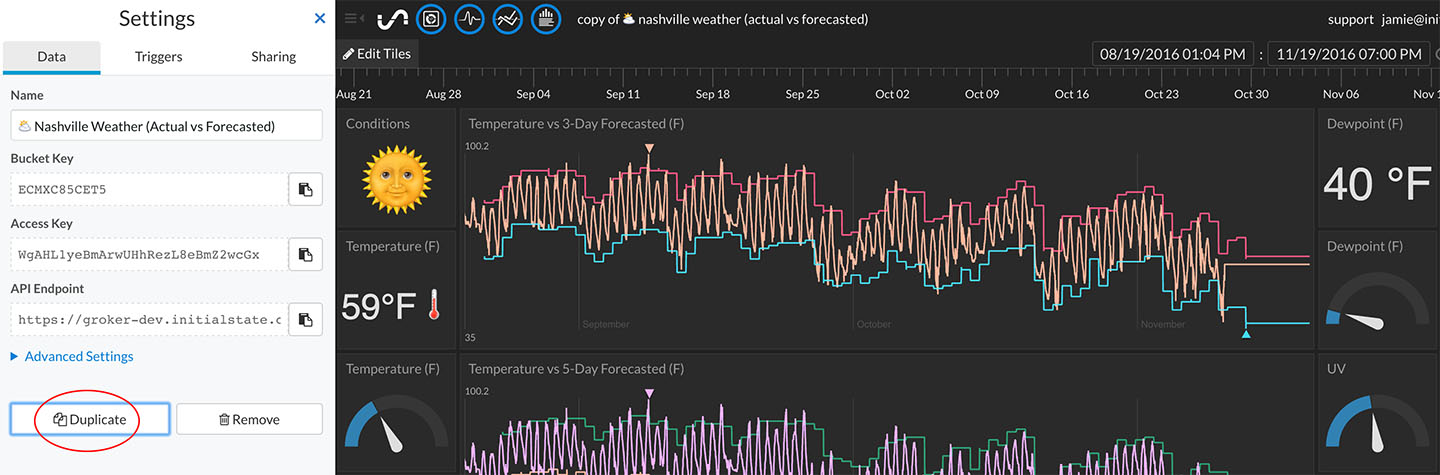
You can duplicate a data bucket view by clicking the "settings" link underneath the bucket name on the bucket shelf then clicking on the "Duplicate" button. This will create a new view of that same data bucket named "Copy of [bucket name]". This allows you to create a different Tiles layout, a different Waves layout, load a different timespan, etc. Read more ...
Nov 4, 2016
Switch Between Data Views in Waves
To change the view type of one or more signals in Waves, right-click on the desired signals and select the view type from the drop-down menu, -> view as spark line, view as event pins, or view as labels. You can also select the desired view type of signals using the same options under the Tools menu. Read more ...
Nov 4, 2016
Rename Signals in Waves
Rename signals in Waves by right-clicking on a signal name and selecting "rename" from the drop-down menu. You can also rename a signal using the rename option under the Tools menu. Read more ...
Oct 31, 2016
Real-Time Expressions
Real-time expressions allow you to instantly manipulate, transform, and filter data inside of data visualization apps such as Tiles and Waves. This allows you to make changes and calculations on your data without having to export your data to another application. Incoming data will be automatically transformed in real-time based on the input expression. Read more ...
Oct 31, 2016
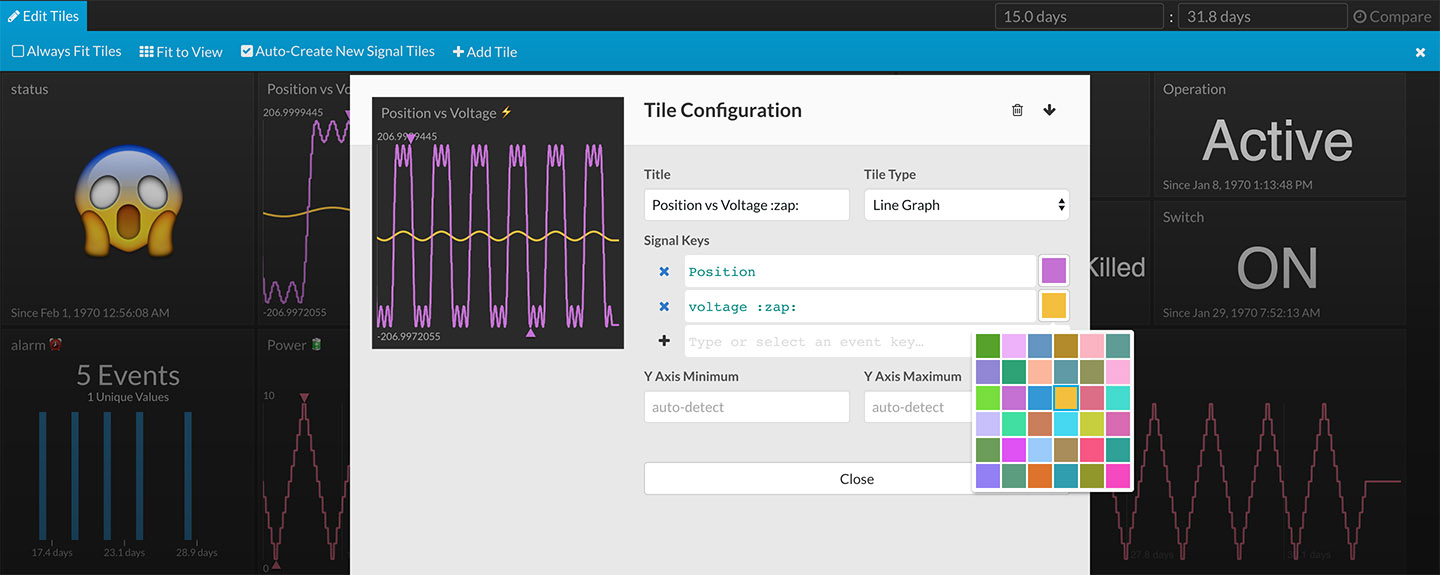
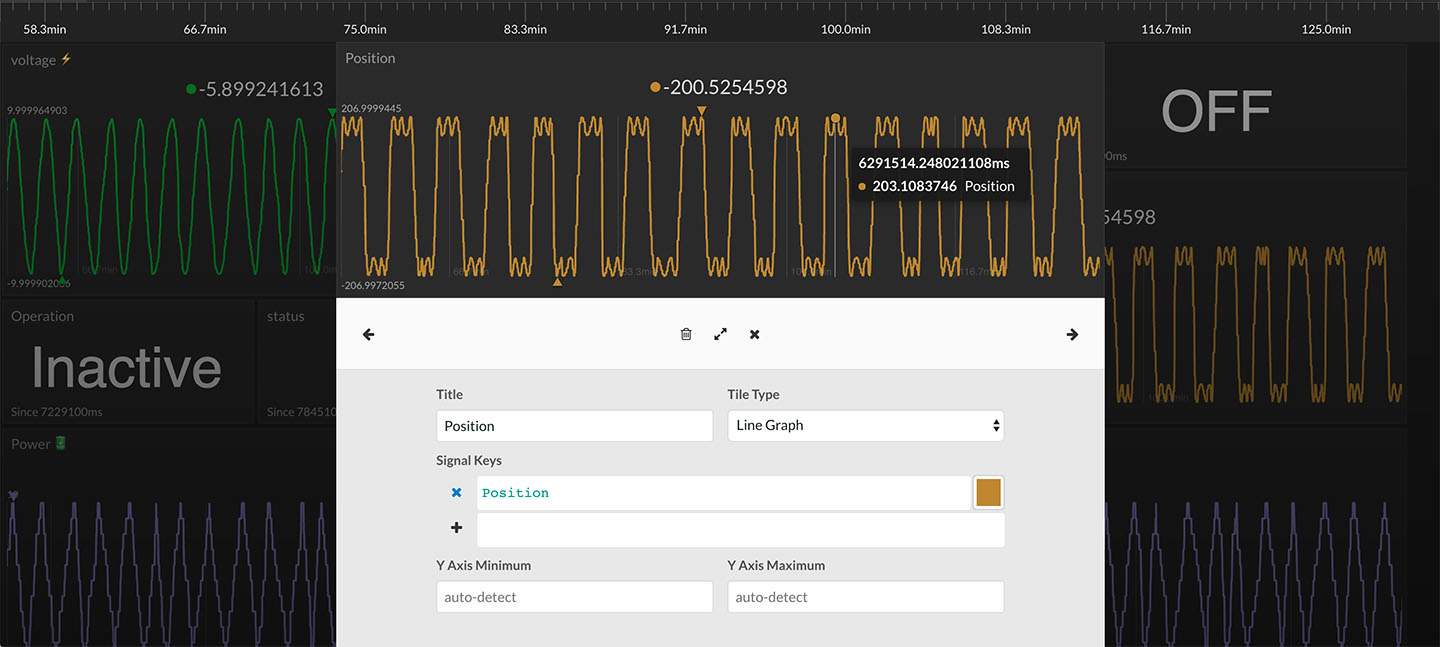
Choose Your Line Graph Color
You can now select the color of each of your line graphs in your Tiles dashboard. The new color icon under tile configuration for Line Graph view types can be found to the right of each signal key input field. Read more ...
Oct 13, 2016
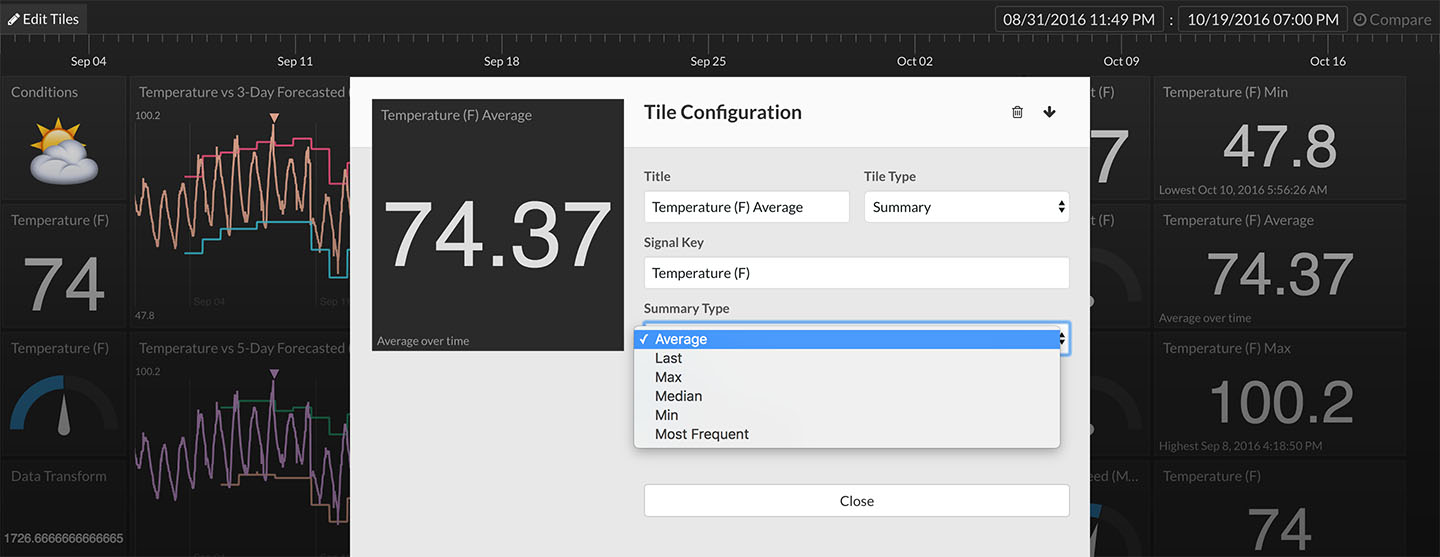
Real-Time Statistic Tiles
You can now display real-time statistics on your Tiles dashboard. Set a tile to display numerical average, min, max, median, and more using the new Summary tile. All statistics are calculated in real-time as data is streamed in. You can also use the Summary tile to instantly calculate statistics for data in a specific slice of time. Read more ...
Sept 18, 2016
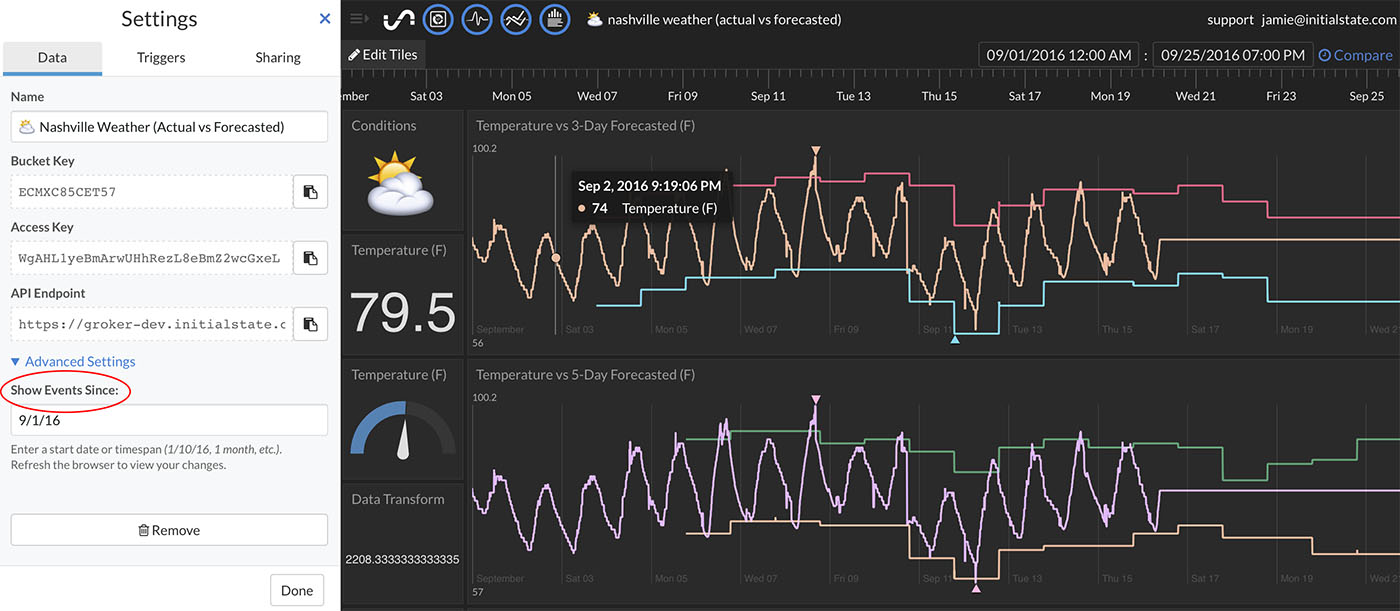
Set Bucket Load Timespan
You can now limit loading data to a specific date or timespan. For example, you can load data since an absolute date (e.g. 9/1/2016) or from a relative timespan (e.g. last 2 weeks). This option is available in the "Advanced Settings" section of each bucket's settings. Read more ...
Sept 2, 2016
Timeline Zoom/Pan
You can now zoom in and out of the timeline and pan left and right to give you fine control of a time range selection. You can use your mouse wheel, the ‘+’ and ‘-‘ keys, or a new right-click dropdown menu to zoom in and out of the timeline. Once you are zoomed in, you can use the → and ← arrow keys to pan the timeline right and left. If you have a mouse that supports panning (e.g. Apple Magic Mouse) or a trackpad, left/right swipe will pan. Read more ...
Sept 2, 2016
Timeline Tail
You can now view or “tail” the data from the last 24 hours, 1 day, 1 week, or whatever time frame you choose. Simply select a time range on the timeline that includes the most recent time (make sure the selection is all the way to the right of the timeline) and the amount of time selected will stay constant but always be updated to include data from the most recent time. As new data streams into view, old data slides out of view. Read more ...
July 12, 2016
Unlimited Real-Time SMS and Email Triggers!
Triggers is our solution to real-time notifications and actions on live data streams. The instant the condition you set becomes true, the action you’ve configured is performed. We wanted to keep pricing as simple as our data streaming and retention pricing; so, starting today, users in the Pro tier will be able to create an unlimited* number of Triggers and receive an unlimited* number of SMS and email notifications. Read more ...
*per the terms of use
July 9, 2016
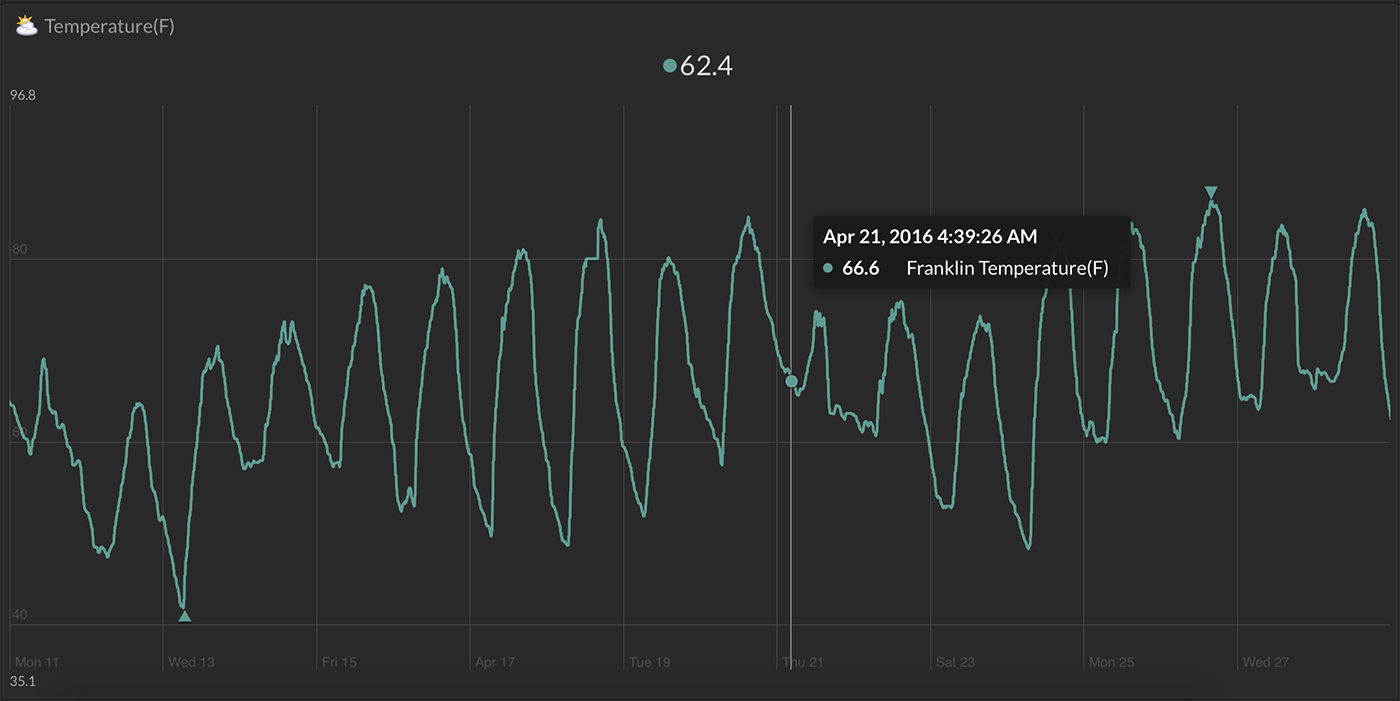
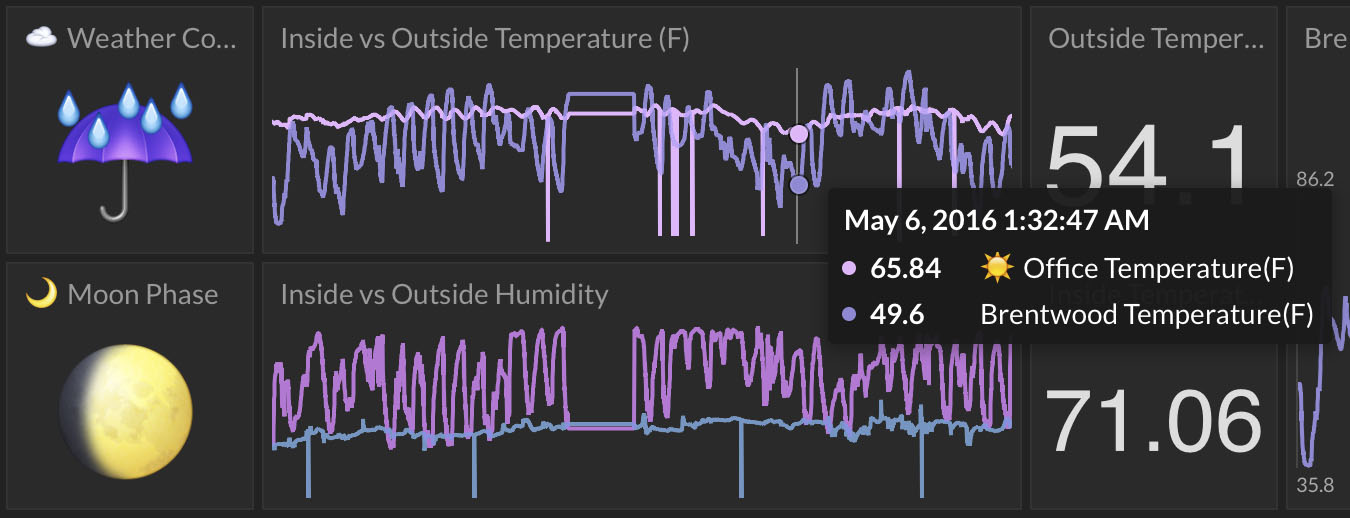
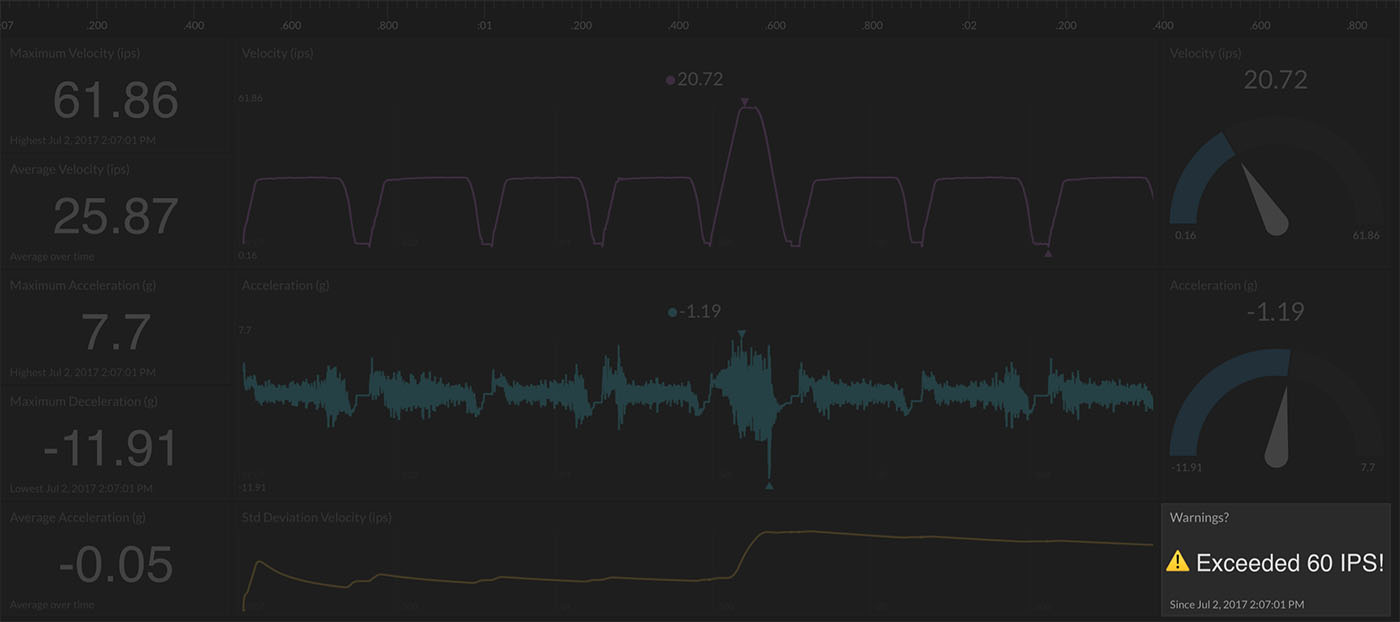
Line Graph Hero Tile
Grid markers now appear for any Line Graph tile resized larger than the default size tile. The grid lines on hero-sized tiles makes reading your data values at a glance even easier.
Notice the little arrows at the very top and bottom of the Line Graphs above? The minimum and maximum values of a signal are now marked on Line Graphs with same-colored arrows. Hovering over the arrow will show you the value. Read more ...
July 9, 2016
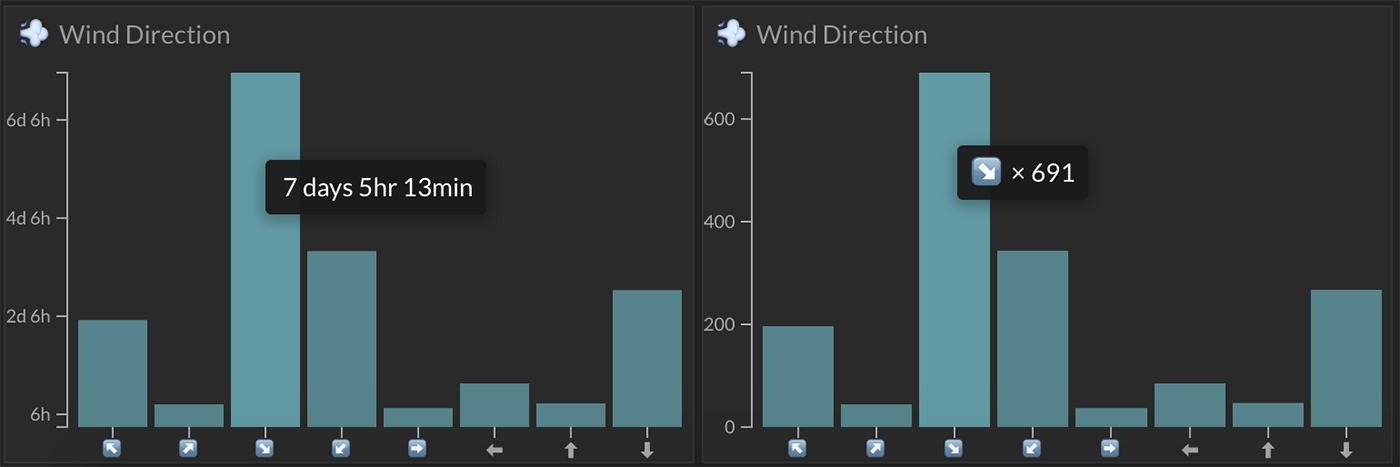
Bar and Pie Chart Comparison Options
A new comparison option is available on bar and pie chart tile configuration. You can now choose between "total time spent as value" and "count of events by value" to drive bar and pie charts. You can see the difference between these two options in the image above.
June 18, 2016
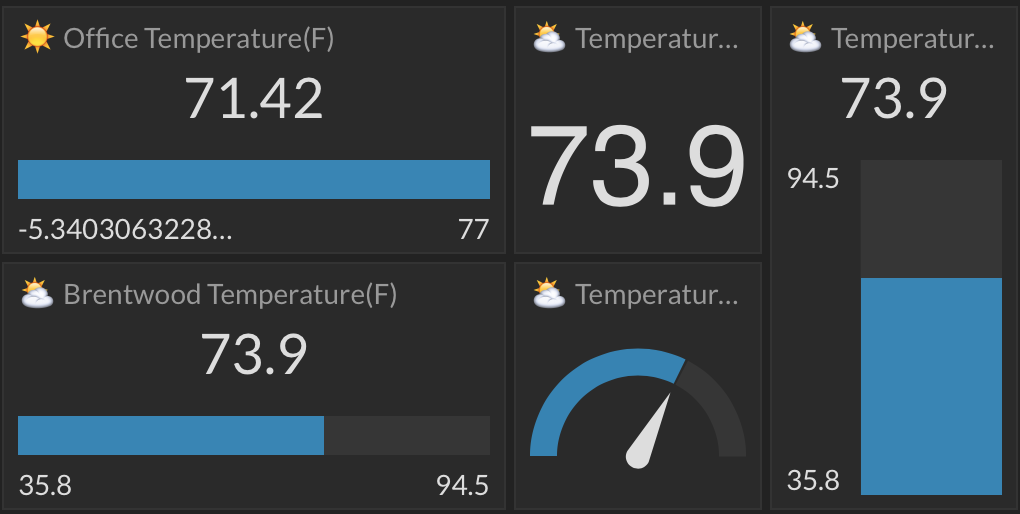
Responsive Gauges
You can now choose from one of three types of gauge views by simply resizing the tile. A square or near-square tile dimension will show a half-circle gauge. A short, wide rectangle dimension will show a single, horizontal bar gauge. A tall, narrow dimension will show a vertical bar gauge. Read more ...
June 18, 2016
Waves Saves
Waves and Lines now auto-save their current state. If you re-order / delete / amplify signals, those changes will be saved for the next time you log in. No longer do you have to be frustrated when you get your workspace just right only to lose that work when you logout.
May 25, 2016
Tiny Tiles
You can now resize tiles to 1/4 the original tile size! This just so happens to provide the ideal dimensions for emojis, smaller pie charts, and even short-‘n-wide line graphs. The size of the tile isn’t the only thing that changes, either. Depending on the tile type, the view is optimized for a smaller size – the last value above the graph might be removed or the font size reduced. Read more ...
May 25, 2016