Importing a Dashboard Design Template
To import a dashboard design template into your new data bucket (e.g. from one of the dashboard design templates listed here), follow the following steps/example:
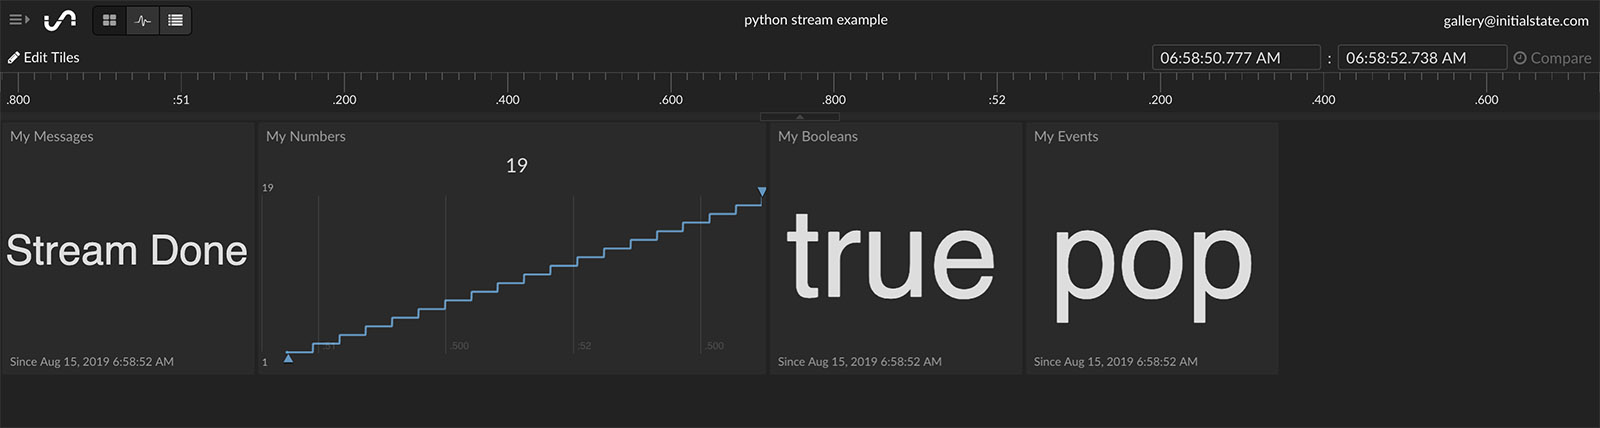
Step 1: Current data bucket that is boring and in need of a cool design:
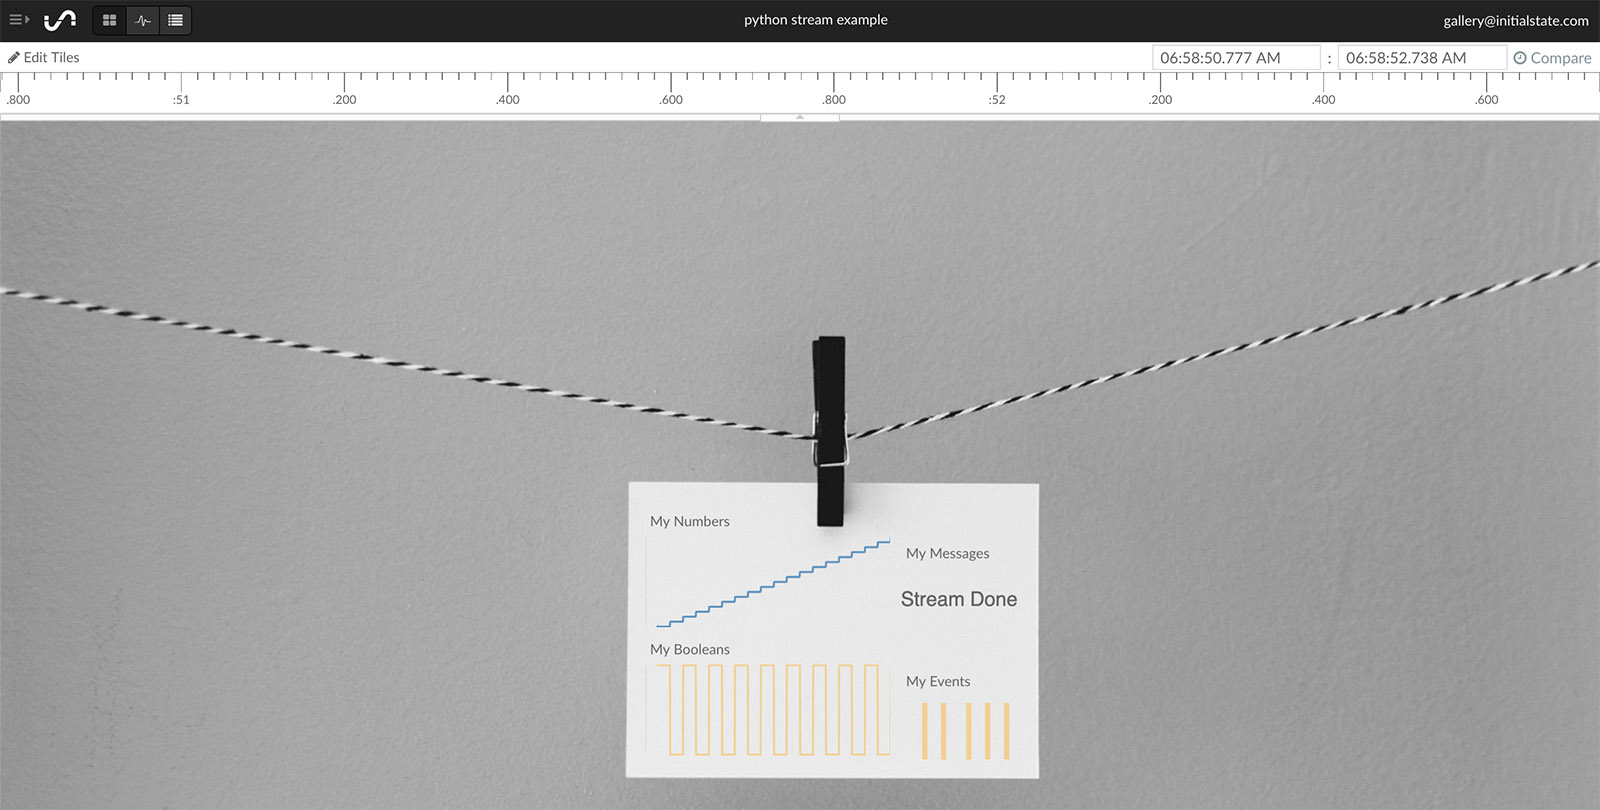
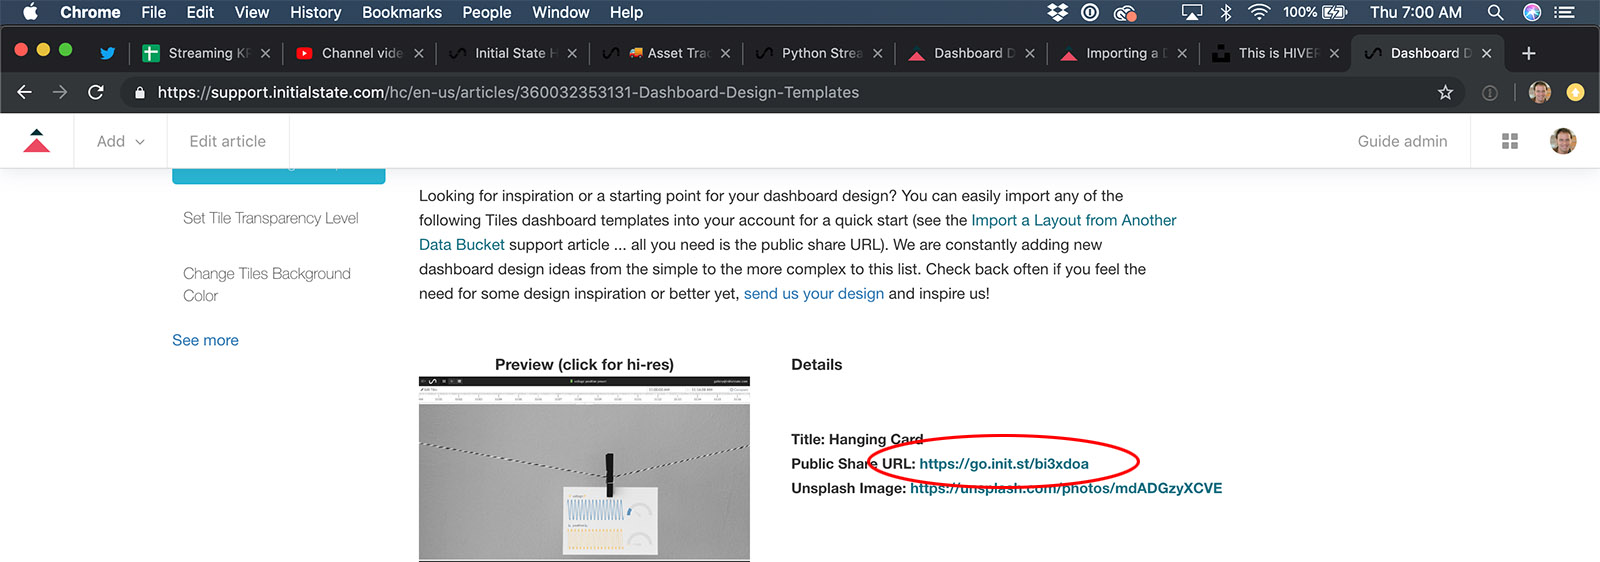
Step 2: A cool dashboard template that can make my boring data bucket look like I want (copy the Public Share URL, e.g. https://go.init.st/bi3xdoa ):
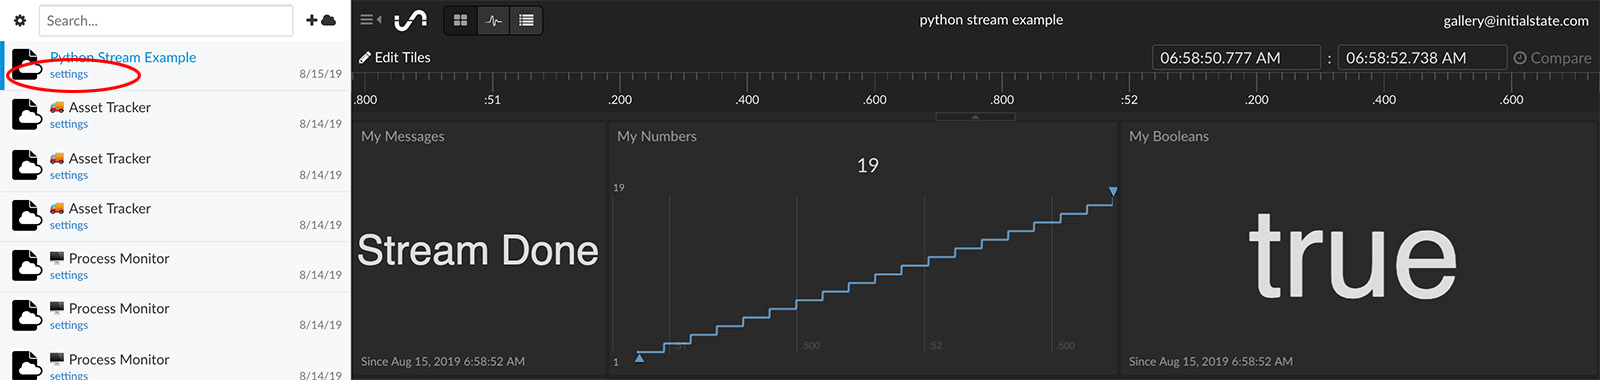
Step 3: Click on the "settings" link under your data bucket in your bucket shelf:
Step 4: Click the "Import View" button in the bucket settings: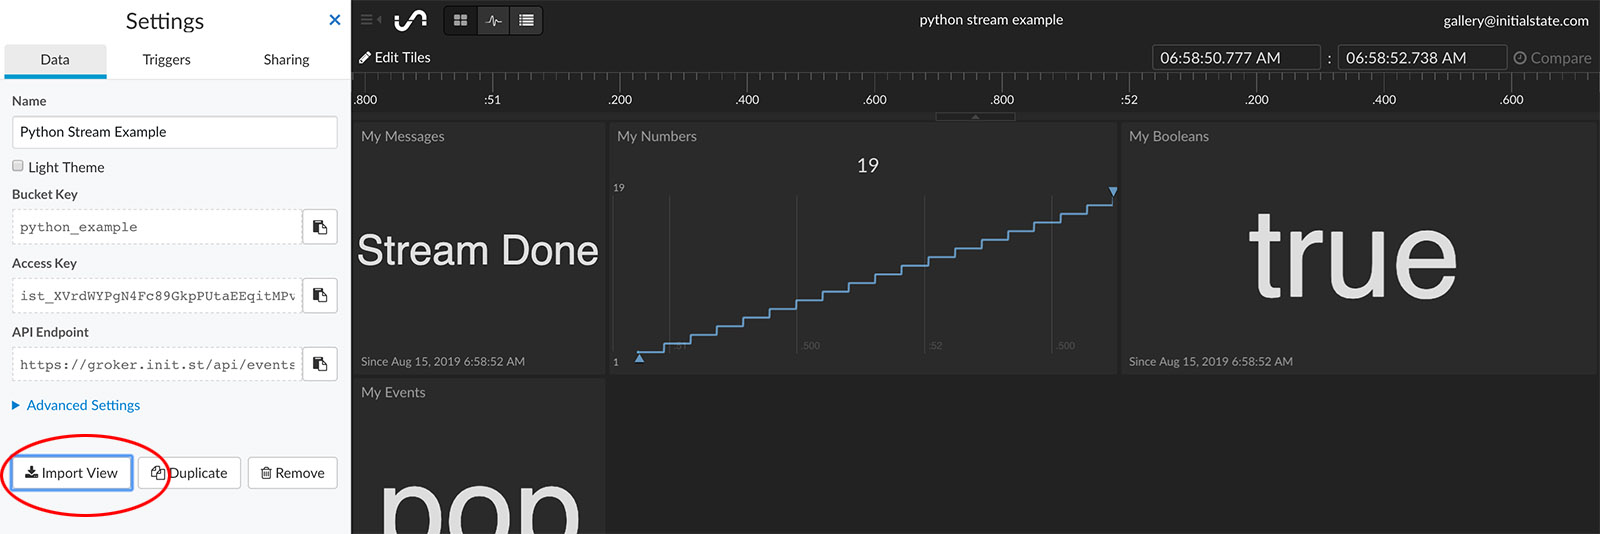
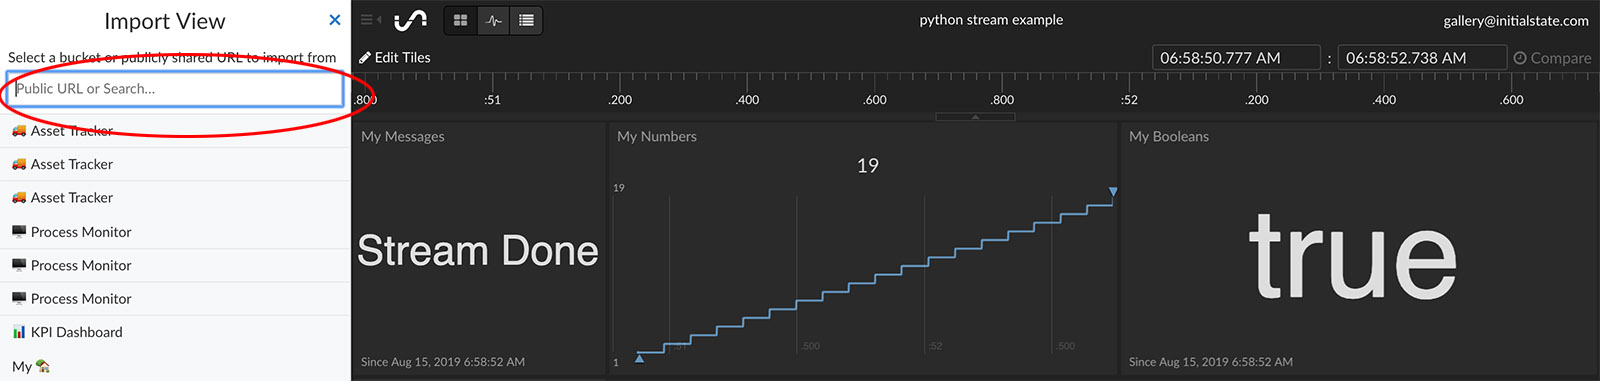
Step 5: Paste the public share URL (e.g. https://go.init.st/bi3xdoa ) into the input field at the top:
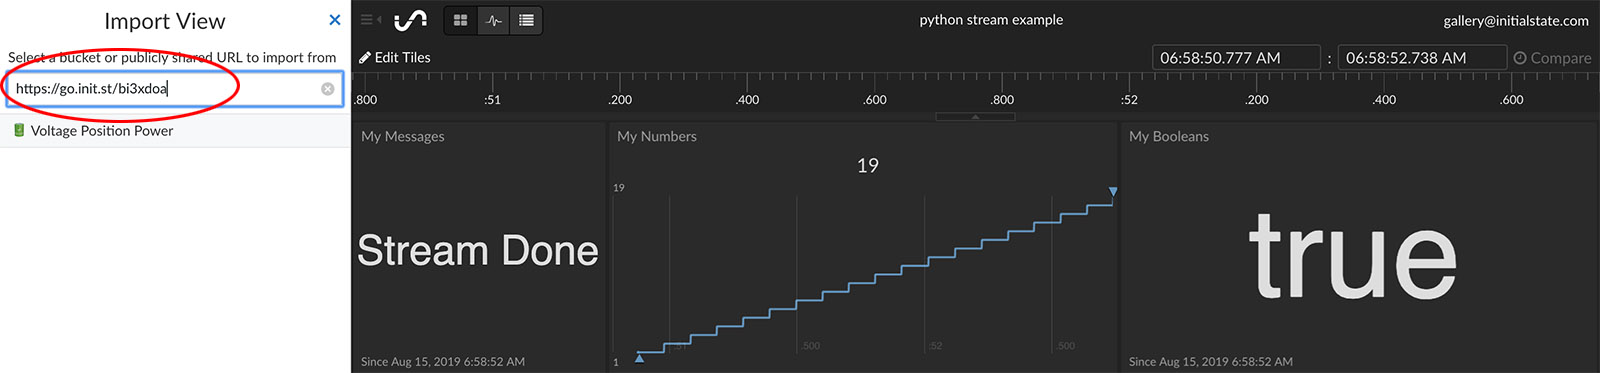
Step 6: A new view to import will appear in the list with a name corresponding to the template you want to import. Click on the name:
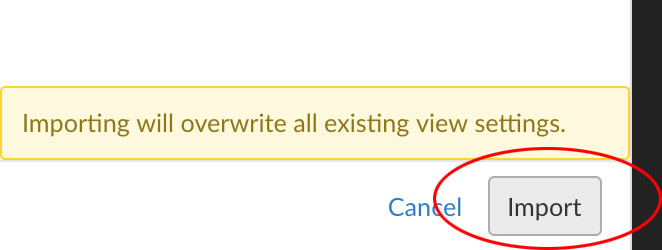
Step 7: Click the "Import" button at the bottom of the screen (this will overwrite all existing view settings for that data bucket view):
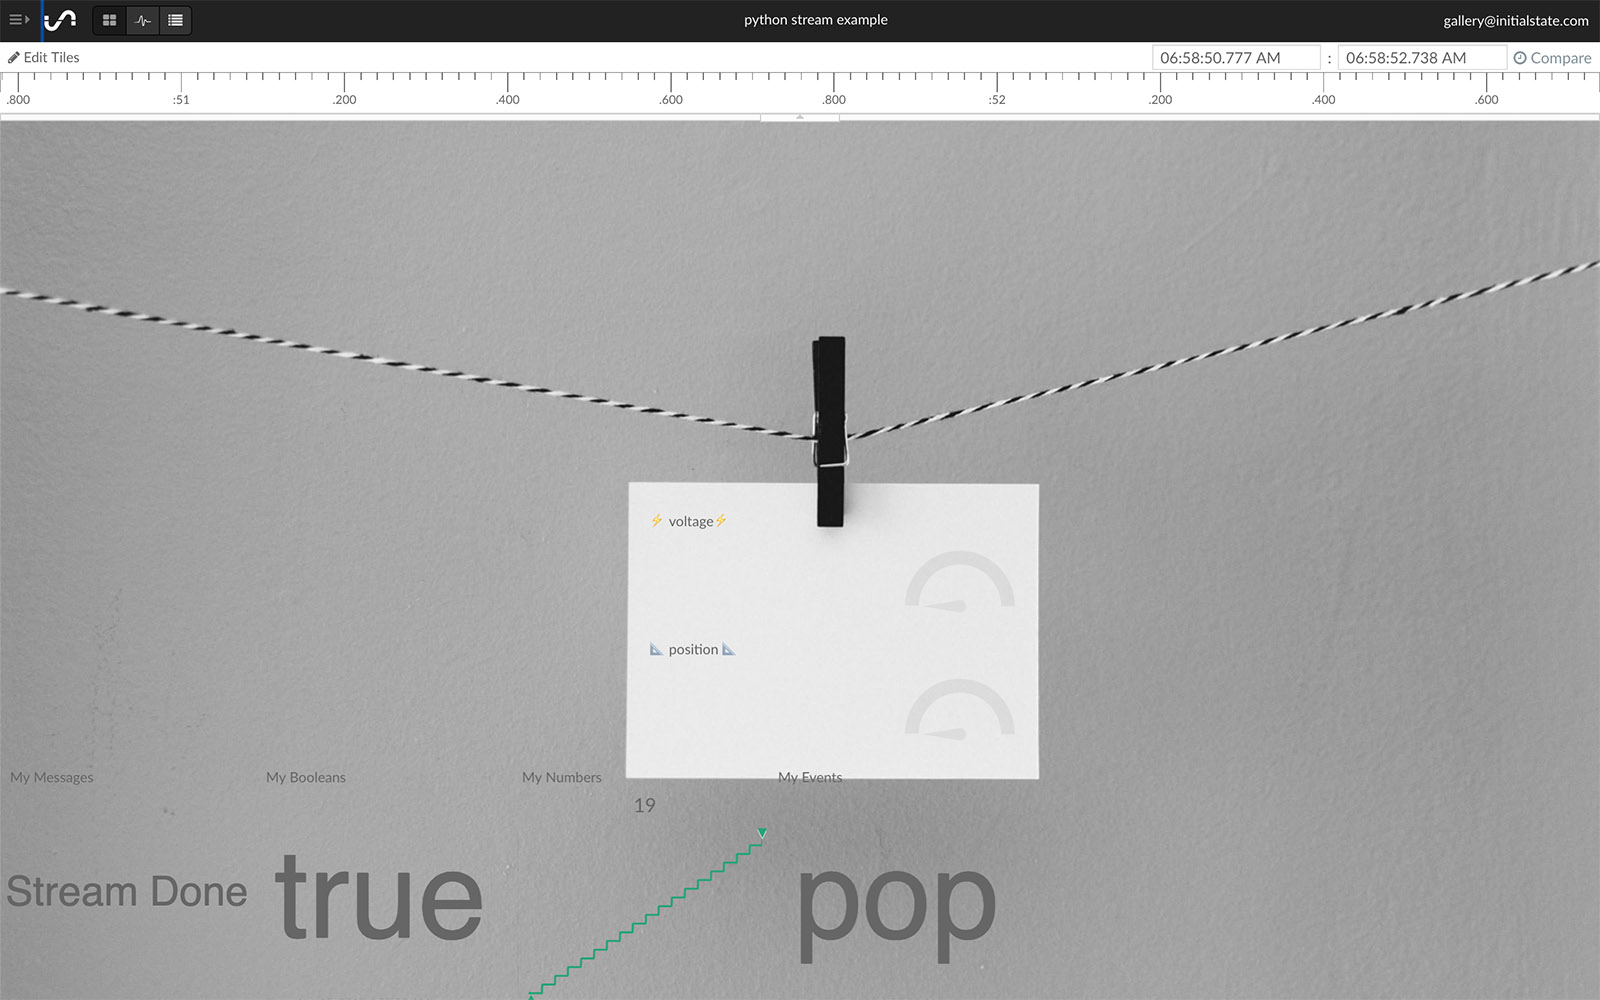
Step 8: The data bucket view will update with the dashboard design template. If you have different signal names than the template (as in the example below), you will see template data tiles with empty data as well as your actual data in tiles in places you don't want:
Step 9: Right-click on the extra, unwanted tiles and select "Remove Tile" to remove them:

Step 10: Once all unwanted tiles are removed, edit the template tiles by right-clicking on a tile and selecting "Edit Tile" from the menu:

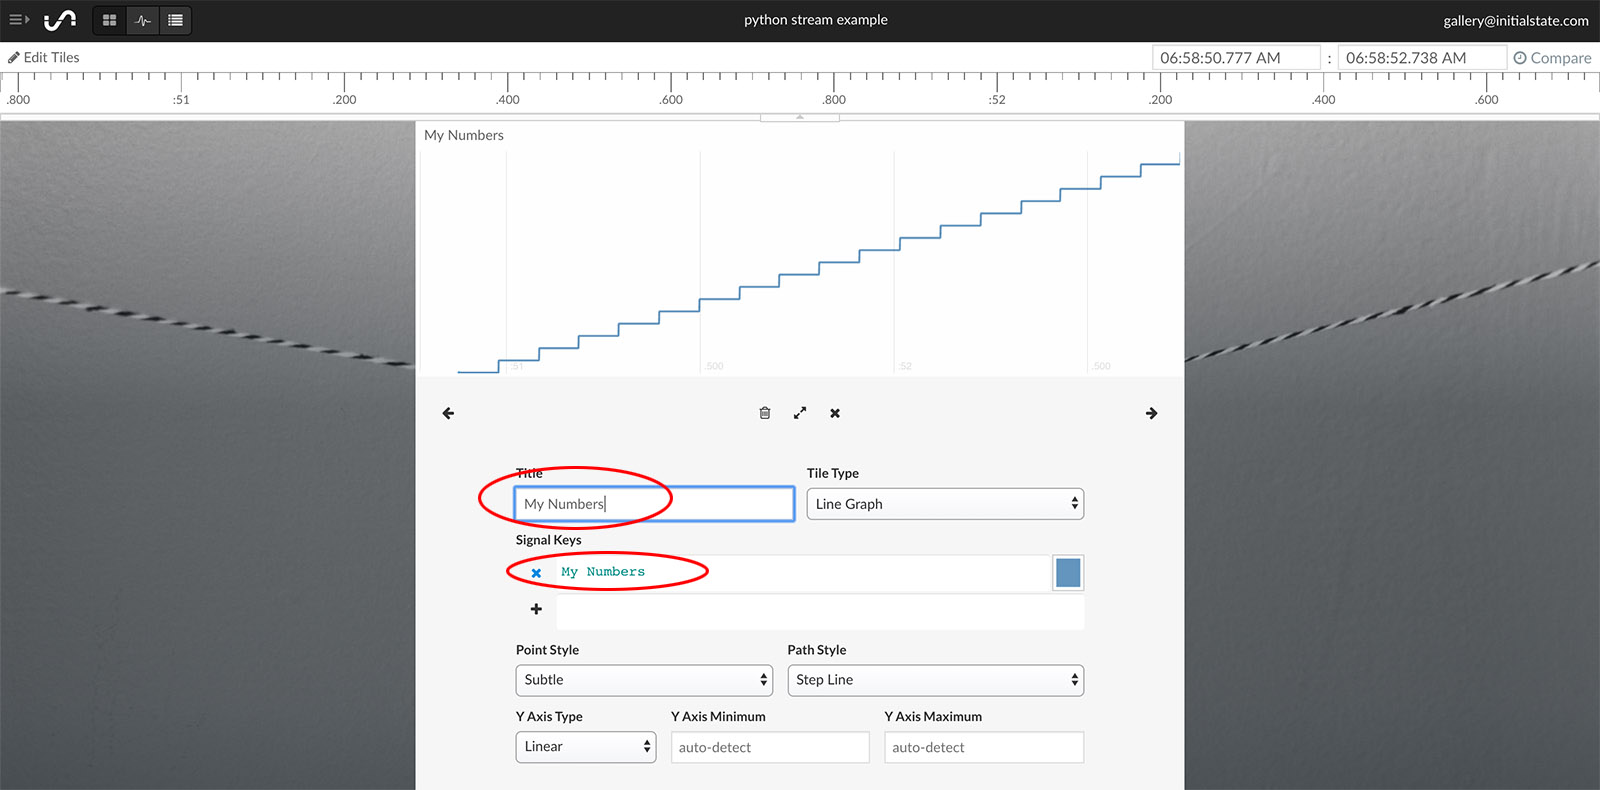
Step 11: Change the Signal Key to your desired data bucket's signal key in each tile. Change the Title to your desired title in each tile. For example, the template had a signal key of "voltage" but the desired signal to be displayed is "My Numbers". This is easily changed in the Signal Keys input field:
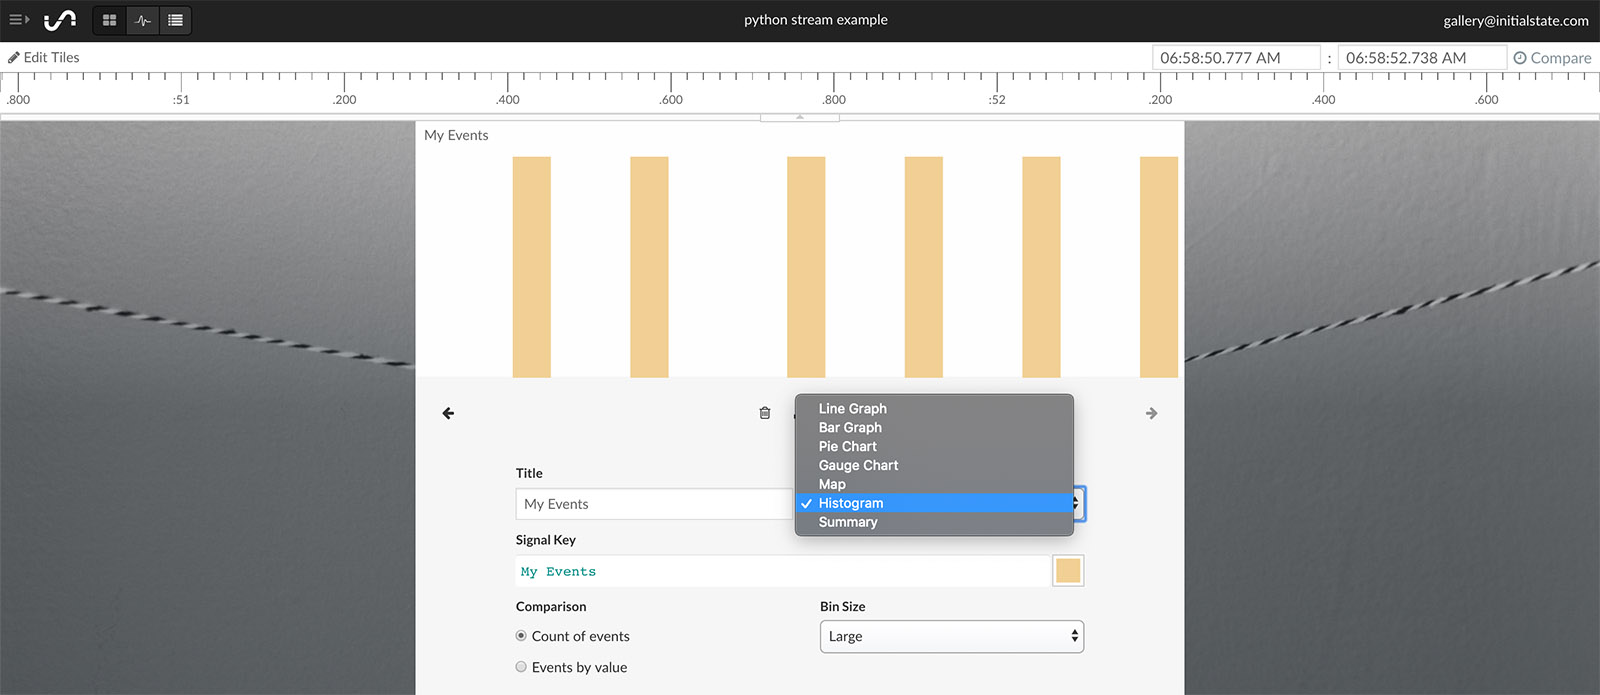
Step 12: You can change the data view for any tile using the "Tile Type" drop-down menu. For example, you can change the gauge graph to a histogram:
Step 13: All done. You imported an entire dashboard design template (background image, tile positions, tile types, real-time expressions, etc.) and applied it to your specific data.