Add Units & Emoji to Data (e.g. 70°F)
Overview
Add units and/or an emoji icon to displayed data to provide context in a Tiles dashboard. This operation utilizes the concatenate operator, &, as well as a string denoted by " ".
Syntax
=[signal] & "text"
Example
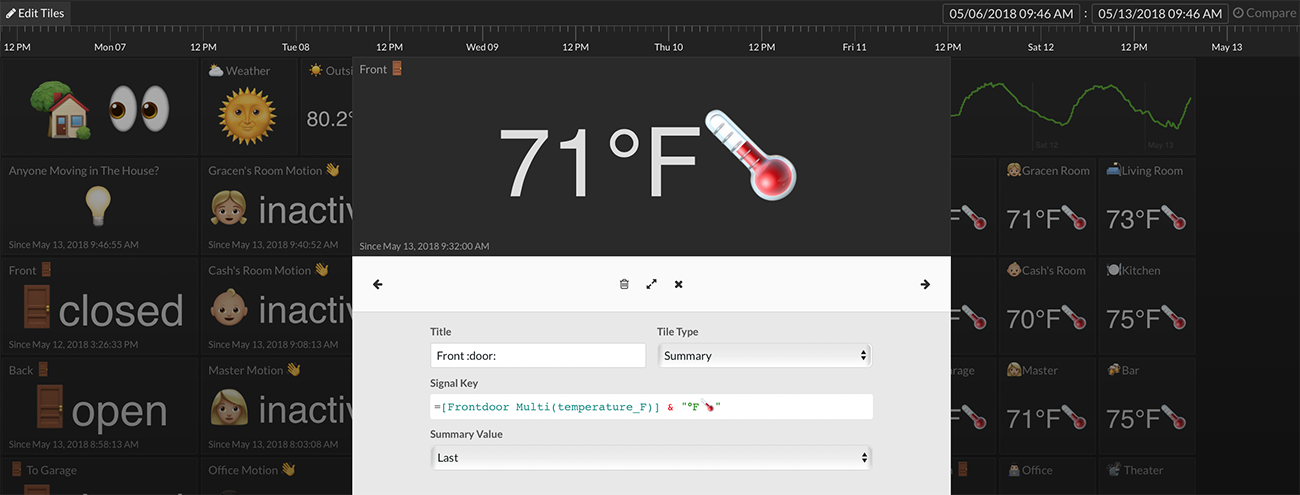
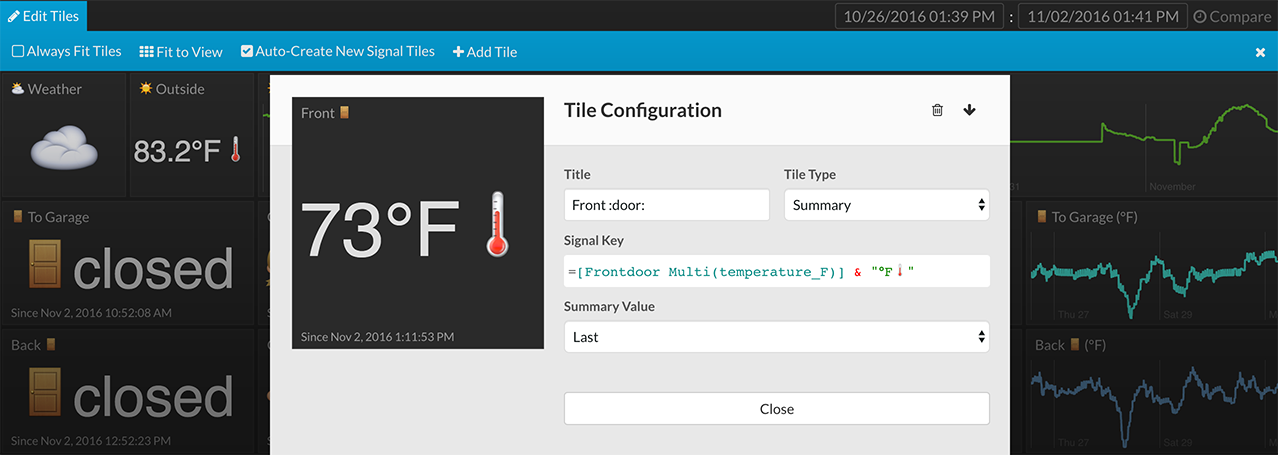
In the example above, a temperature stream is providing numerical data (e.g. 73). To add units to the displayed data in tiles, apply the expression, =[signal] & "°F". The data stream above is named, Frontdoor Multi(temperature_F). The expression used is
=[Frontdoor Multi(temperature_F)] & "°F🌡"
In order to add an emoji icon to the display:
- Find the desired emoji at http://getemoji.com. For the thermometer emoji -> http://emojipedia.org/thermometer/.
- Copy the emoji to the clipboard. This will copy the unicode version of the emoji.
- Paste the emoji inside the double quotes " " in the expression.
Note: If spacing is desired between the data and the added text, place the space inside of the double quotes (e.g. " °F").
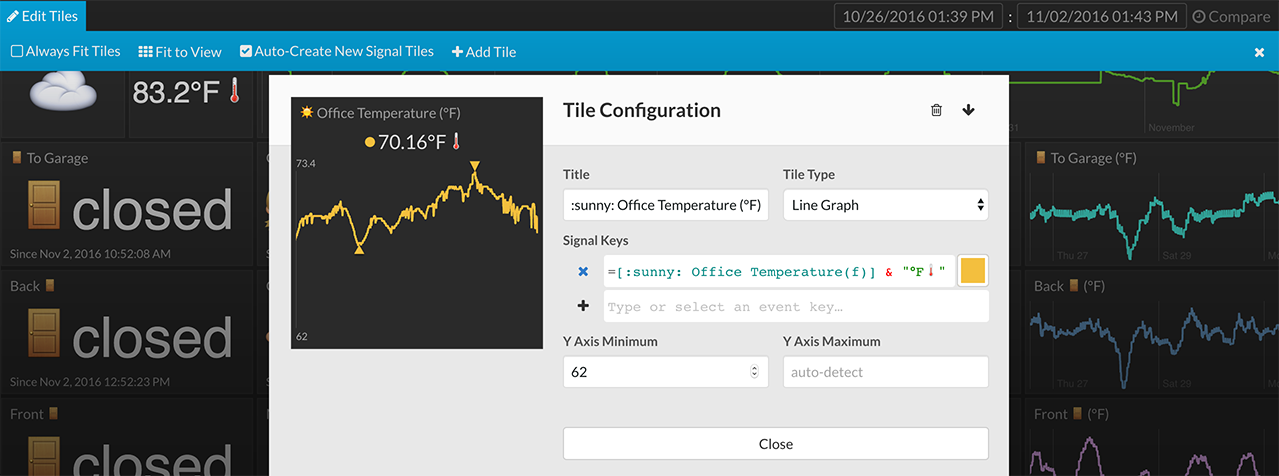
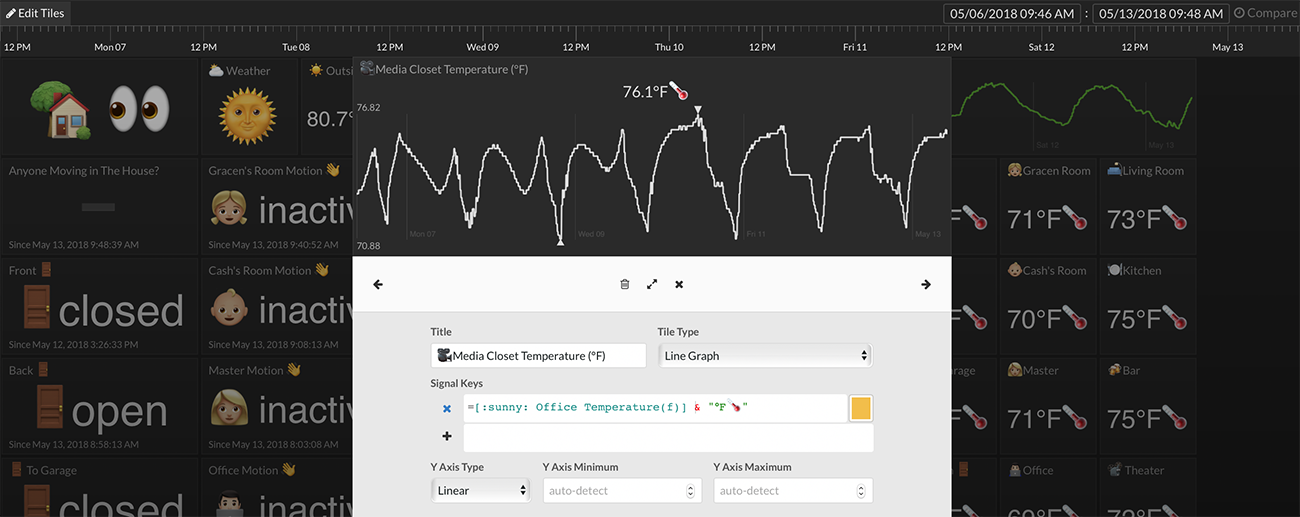 Units and emojis can be appended to a numerical data stream and still be viewed as a line graph as shown above. However, prepending text before the numerical value will prevent a line graph from drawing.
=[:sunny: Office Temperature(f)] & "°F🌡"
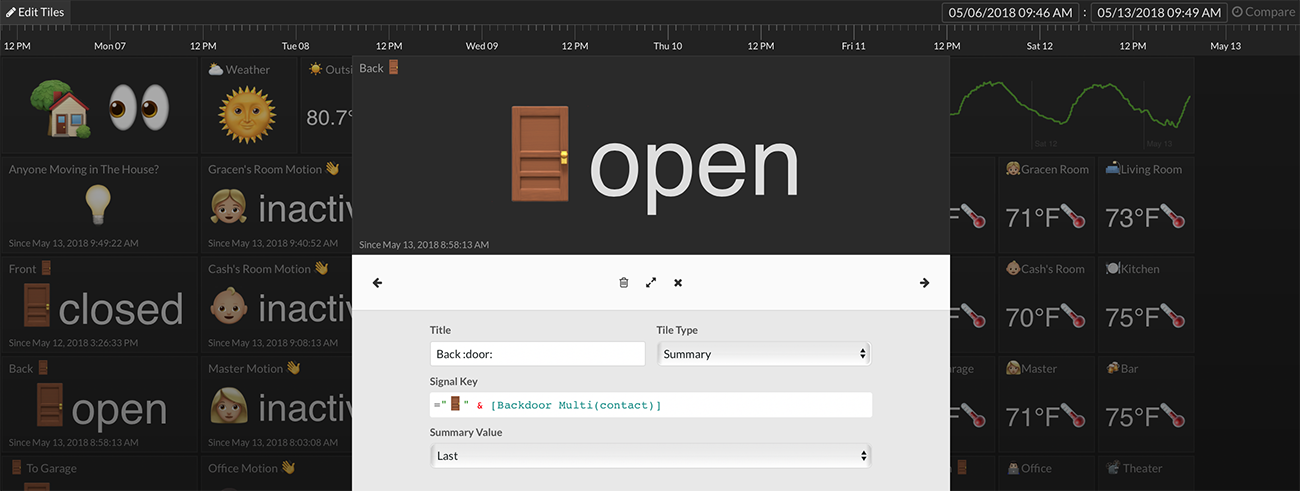
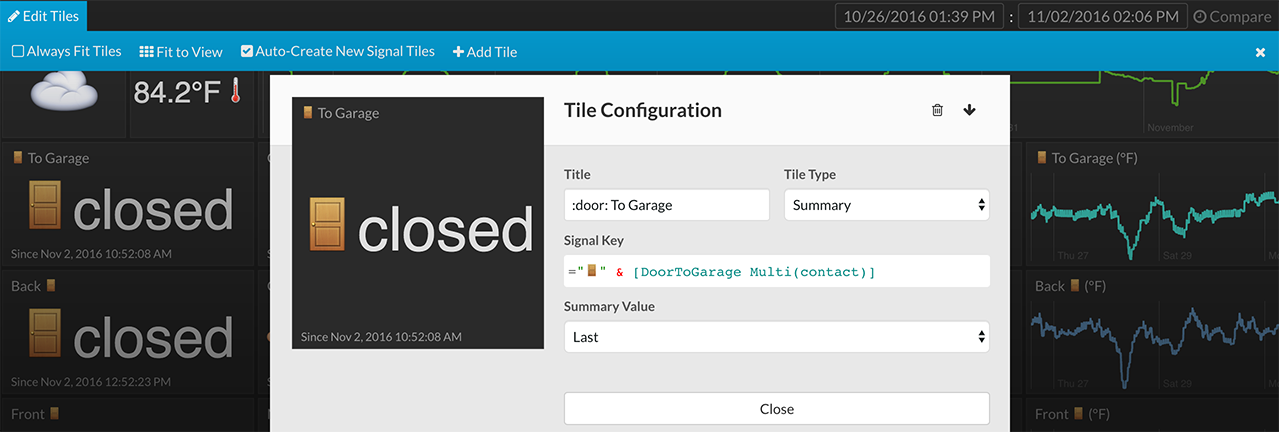
Context can be added to door sensors using this same approach (door emoji -> http://emojipedia.org/door/).
="🚪" & [Backdoor Multi(contact)]
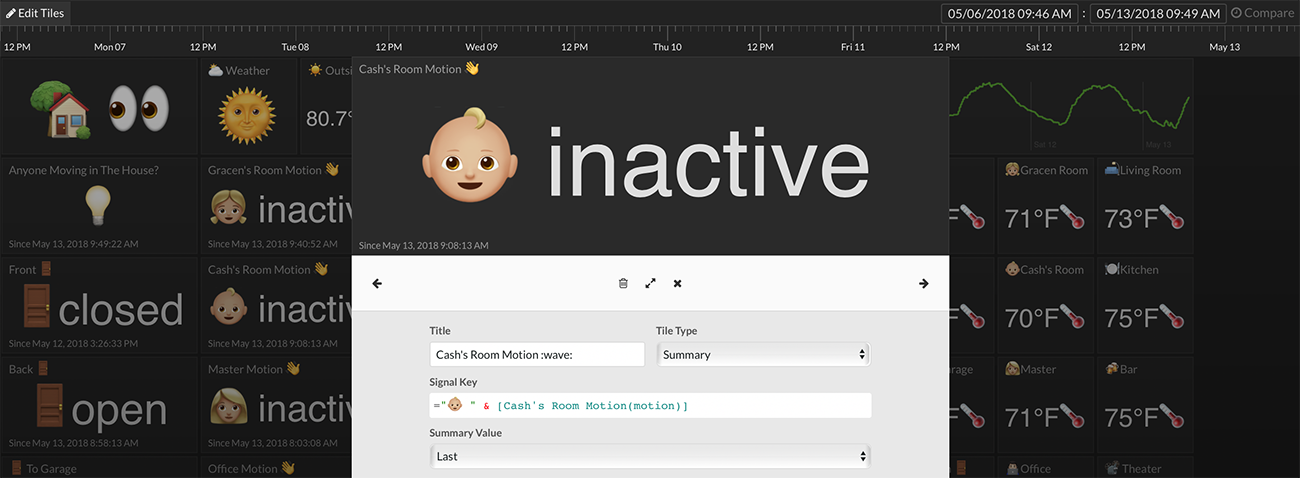
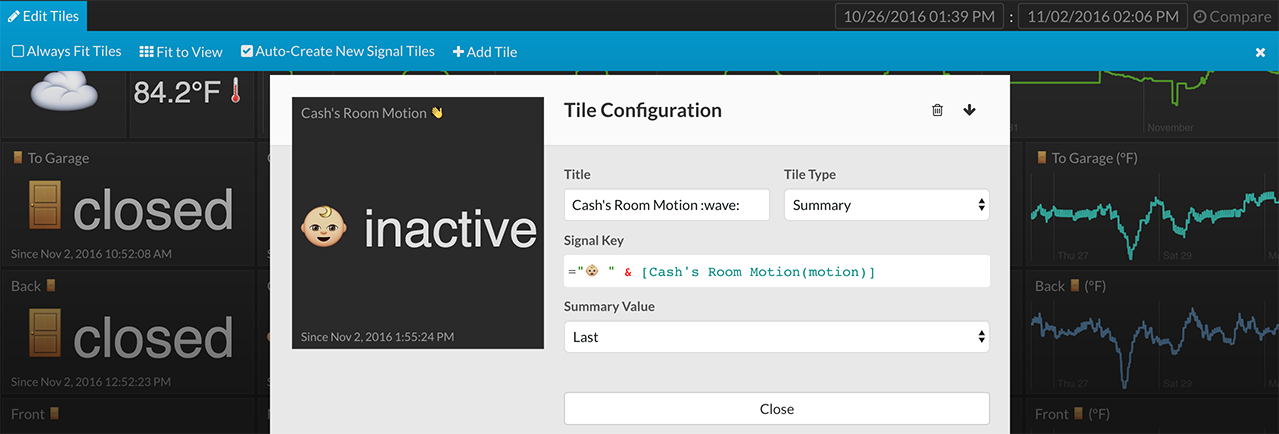
Context can be added to motion sensors using this same approach (baby emoji -> http://emojipedia.org/baby-type-3/).
="👶🏼 " & [Cash's Room Motion(motion)]