Smooth Out a Noisy Line Graph
Overview
Apply a smoothing filter on a numerical data stream viewed as a line graph.
Syntax
Default smoothing (assumes a smoothFactor = 0.7)
=smooth([data stream])
Specific smoothFactor (0 to 1; 0 = no smoothing; 1 = maximum smoothing to a flat line)
=smooth([data stream], smoothFactor)
Example
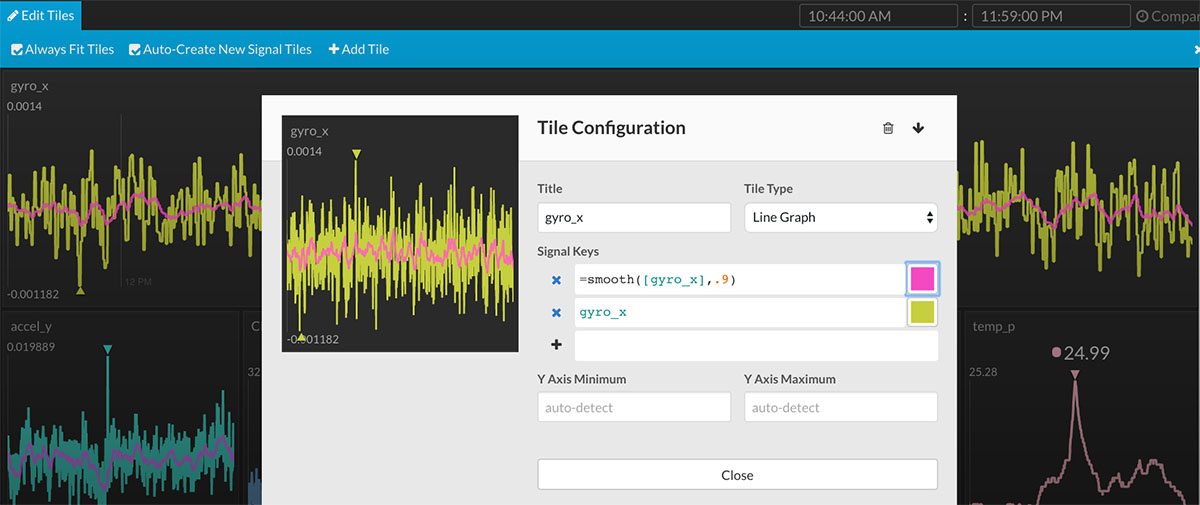
=smooth([gyro_x], 0.9)
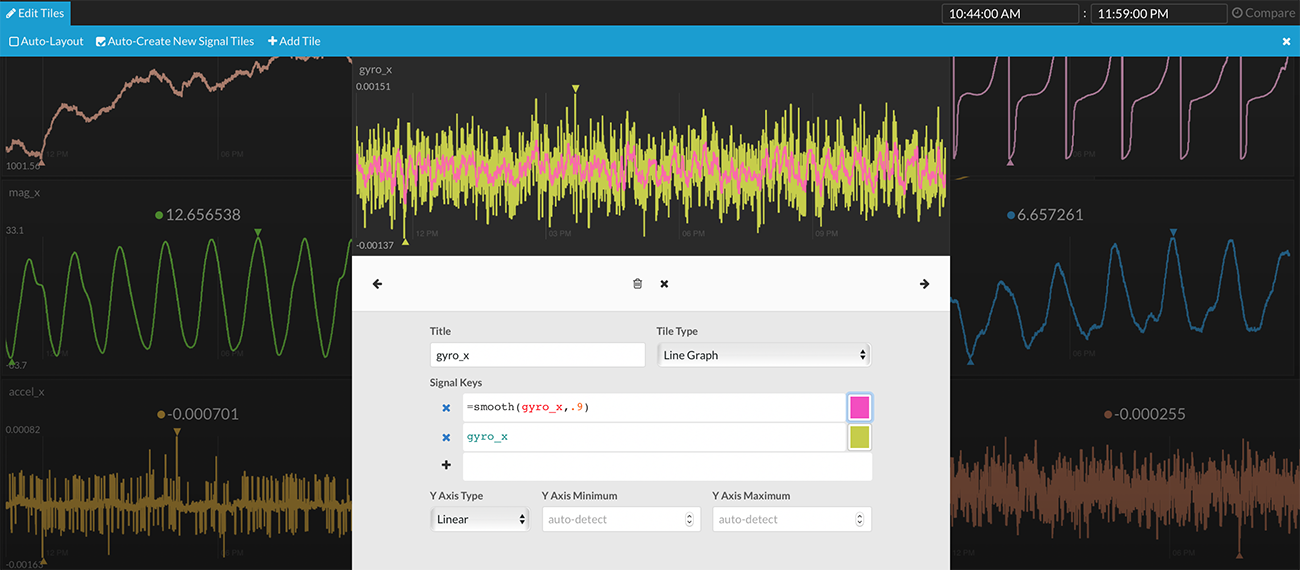
In the example above, the original line graph (in yellow) is shown underneath the smoothed line (in pink).
Uses with other Expressions
You can combine =smooth with other expressions. For example, an unwanted data point could be filtered out before the smoothing function is applied by nesting the filter operation inside the smooth function parameters:
=smooth(([data stream] != 1000), 0.8)