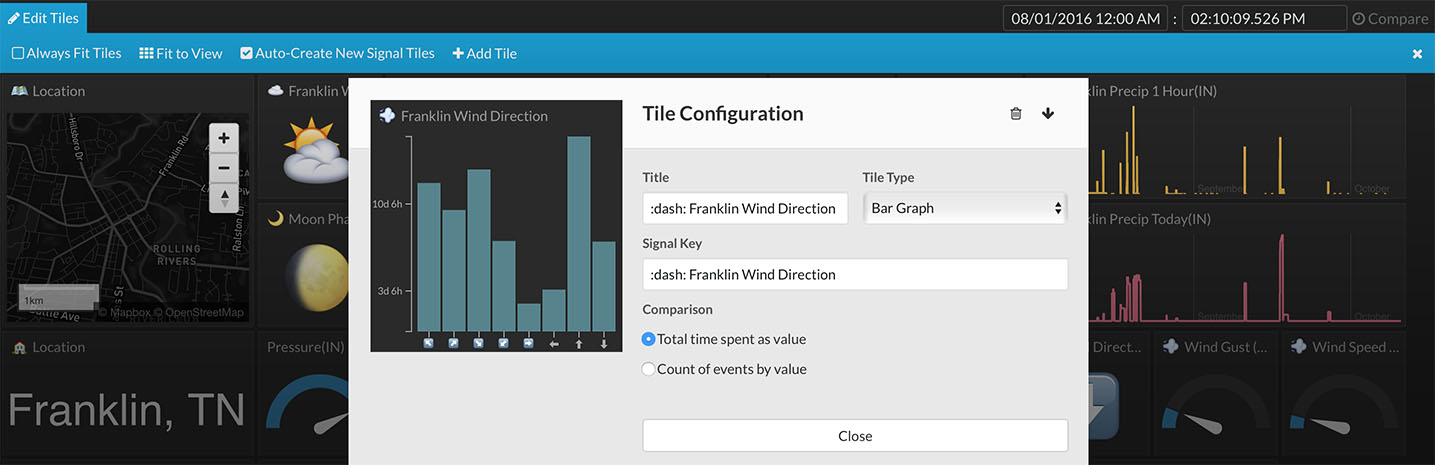
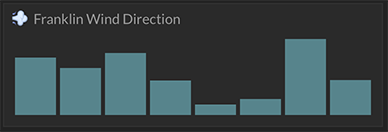
Data View Type - Bar Graph
Tile Configuration
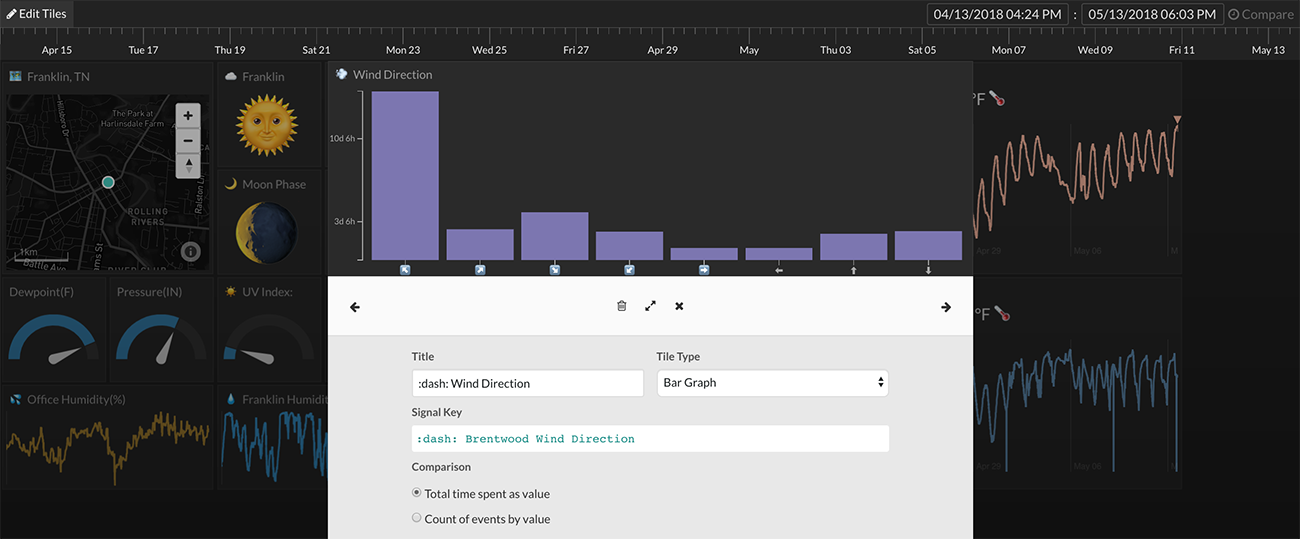
The bar graph tile view shows either the duration in time or the count of a specific value of a data stream. A bar for each unique value in the data stream will be displayed in the bar graph view. Bar graph view options can be set in the Tile Configuration (right-click on tile -> Edit Tile).
Total Time Spent as Value
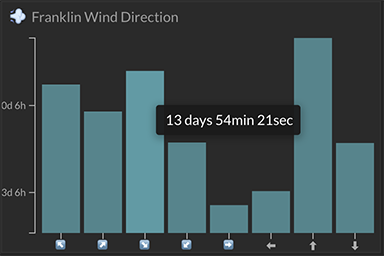
Selecting the total time spent as value option will use the duration of each unique value to draw each bar. The longer in time a specific value is present in a data stream, the taller its bar will be drawn.
Count of Events by Value
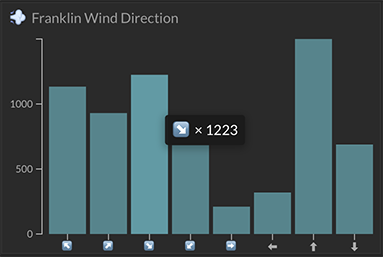
Selecting the count of events by value option will use the number of occurrences of each unique value to draw each bar. The more frequent a specific value occurs in a data stream, the taller its bar will be drawn. Time is ignored in the count of events by value option.
Size/Dimension Options
Sizing down the bar graph tile to minimum height will remove its x and y labels.
Hover
Mouse hover over individual bars will display either its total time or total count.
Color Options
There are no color options for the bar graph view at this time.