Data View Type - Histogram
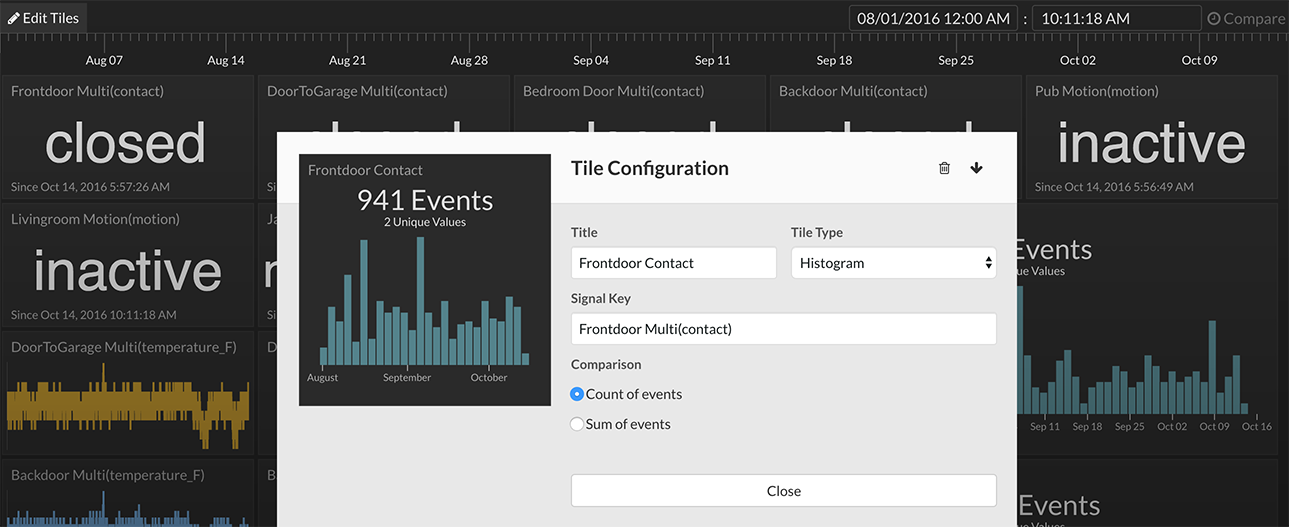
Tile Configuration
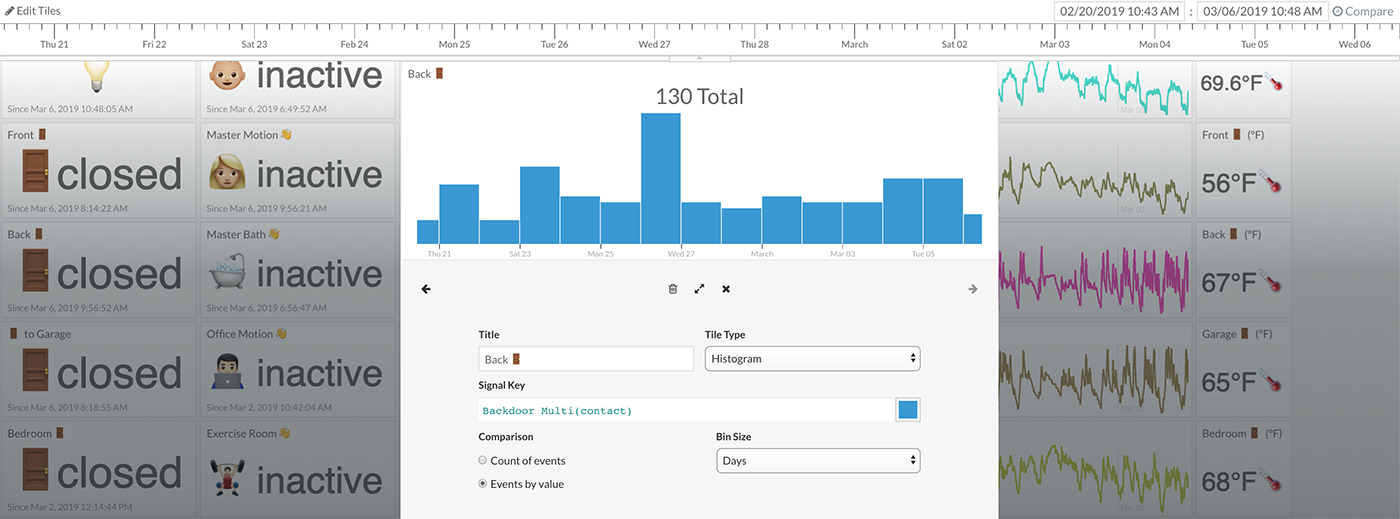
The histogram tile view shows either a count of unique events or sum of values during specific time periods. When used in conjunction with the timeline selection, the histogram allows you to easily see event occurrences for specified windows of time (e.g. every time a door opened in the last 24 hours). Each bin in the histogram represents a time period. Histogram view options can be set in the Tile Configuration (right-click on tile -> Configure Tile).
Comparison Option
Count of events - Selecting this option will display a simple count of every event in a time period regardless of a signal's data type or value.
Events by value - Selecting this option will display the sum of all numeric values of a signal in a time period. Non-numeric signals will show nothing with this option selected unless those values are supported "truthy/falsey" type signals (e.g. on, off, active, inactive).
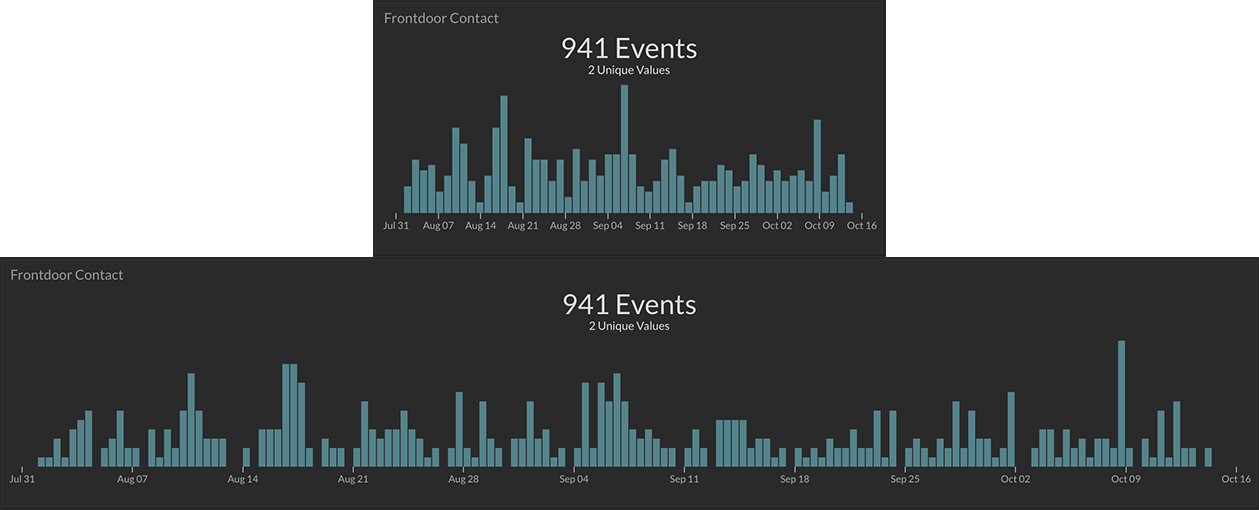
Bin Size
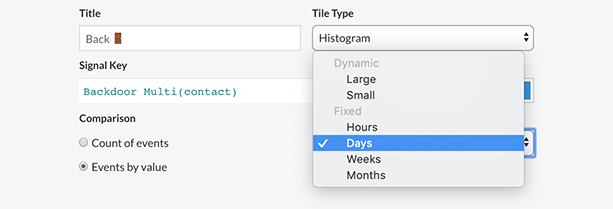
The Bin Size option specifies the time span of each histogram bin. Selecting a Fixed option such as Hours, Days, Weeks, or Months will force the histogram bins to that time range despite the amount of time being viewed. Selecting a Dynamic option such as Large or Small will provide a dynamic bin size based on the amount of time being viewed. Large will lean toward a larger bin size while Small will attempt to draw a smaller bin size dynamically.
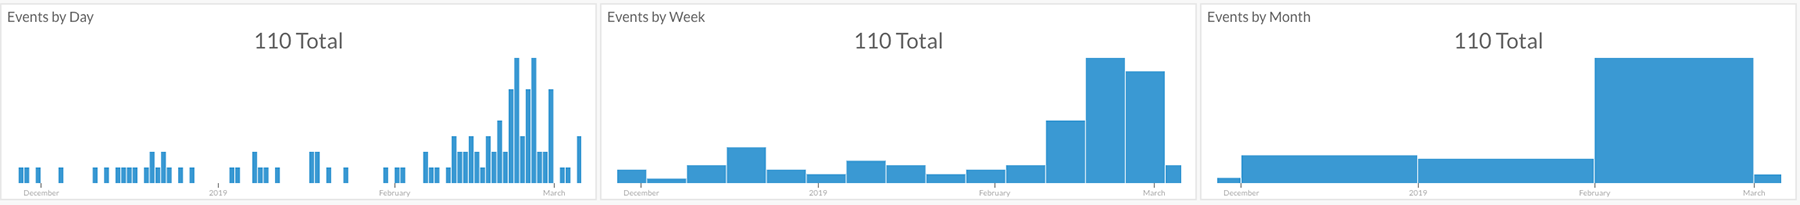
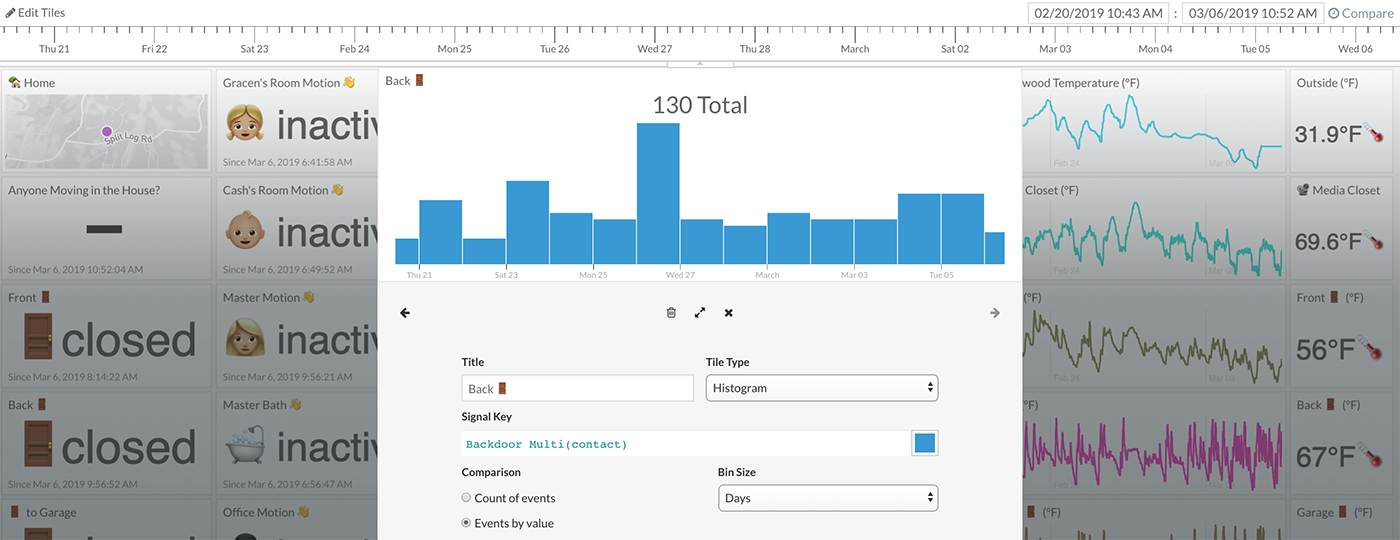
The example above shows the same data displayed as a histogram using bin size Days, bin size Weeks, and bin size Months respectfully.
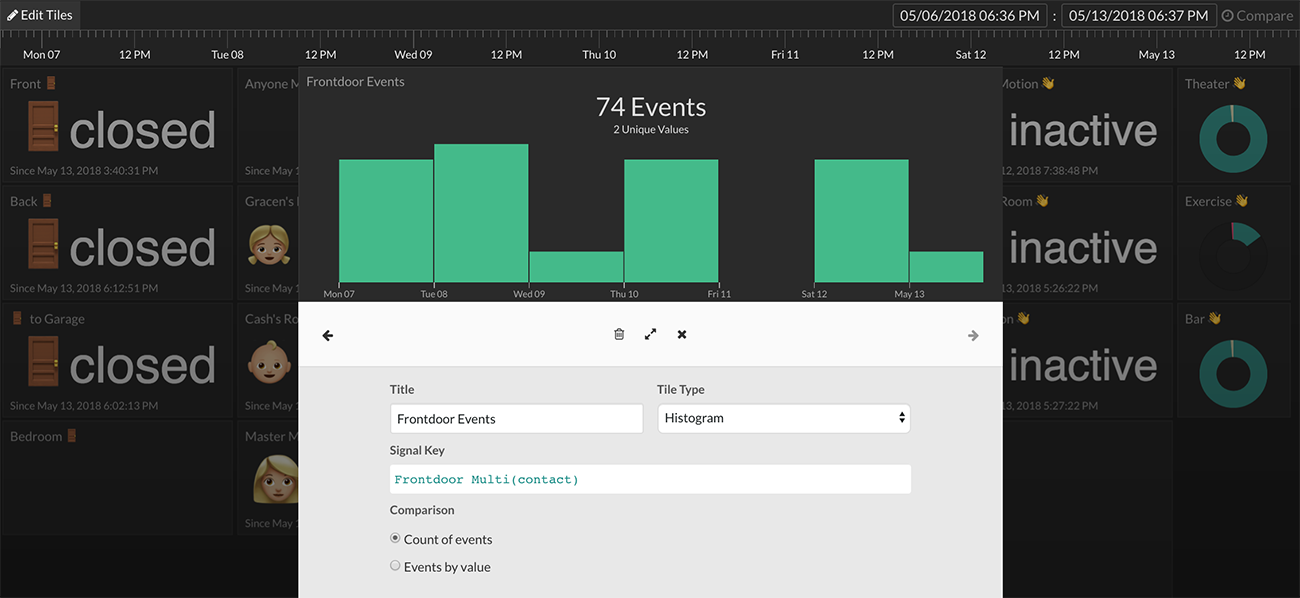
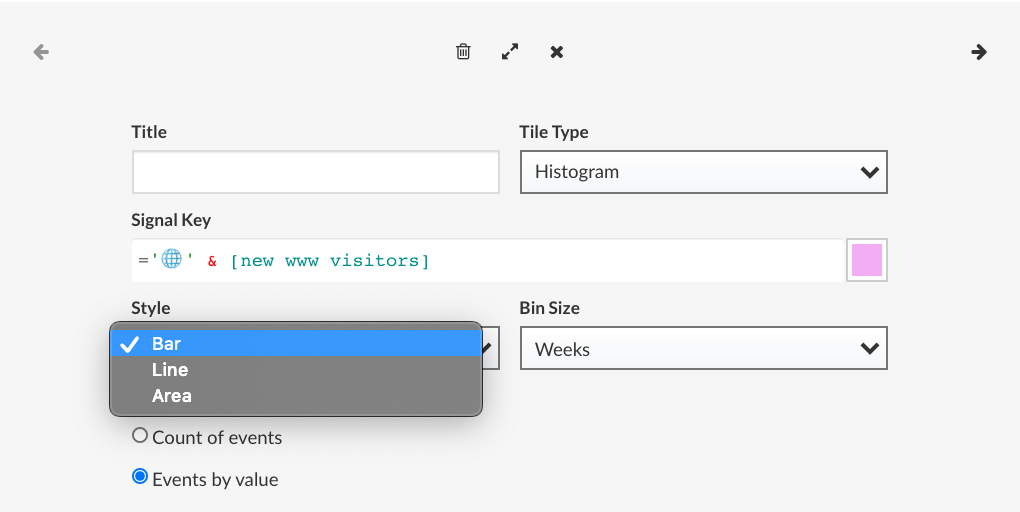
Style
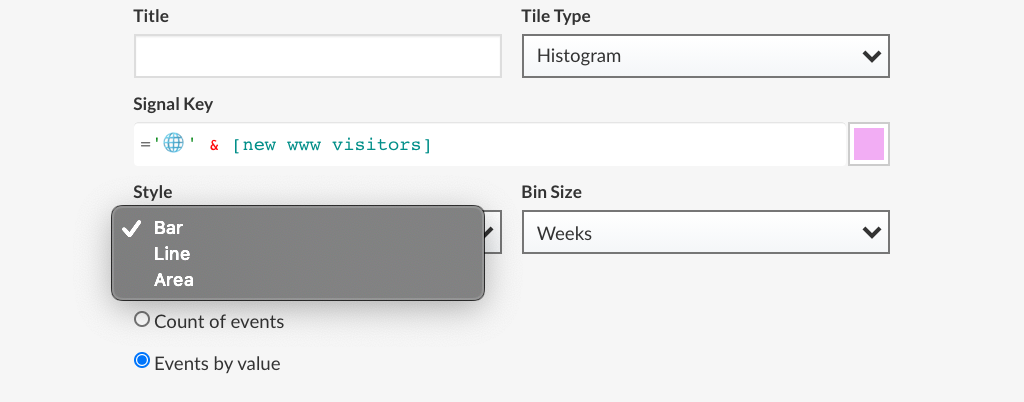
The Style option specifies the draw type of the histogram. Select from Bar, Line, and Area draw types.
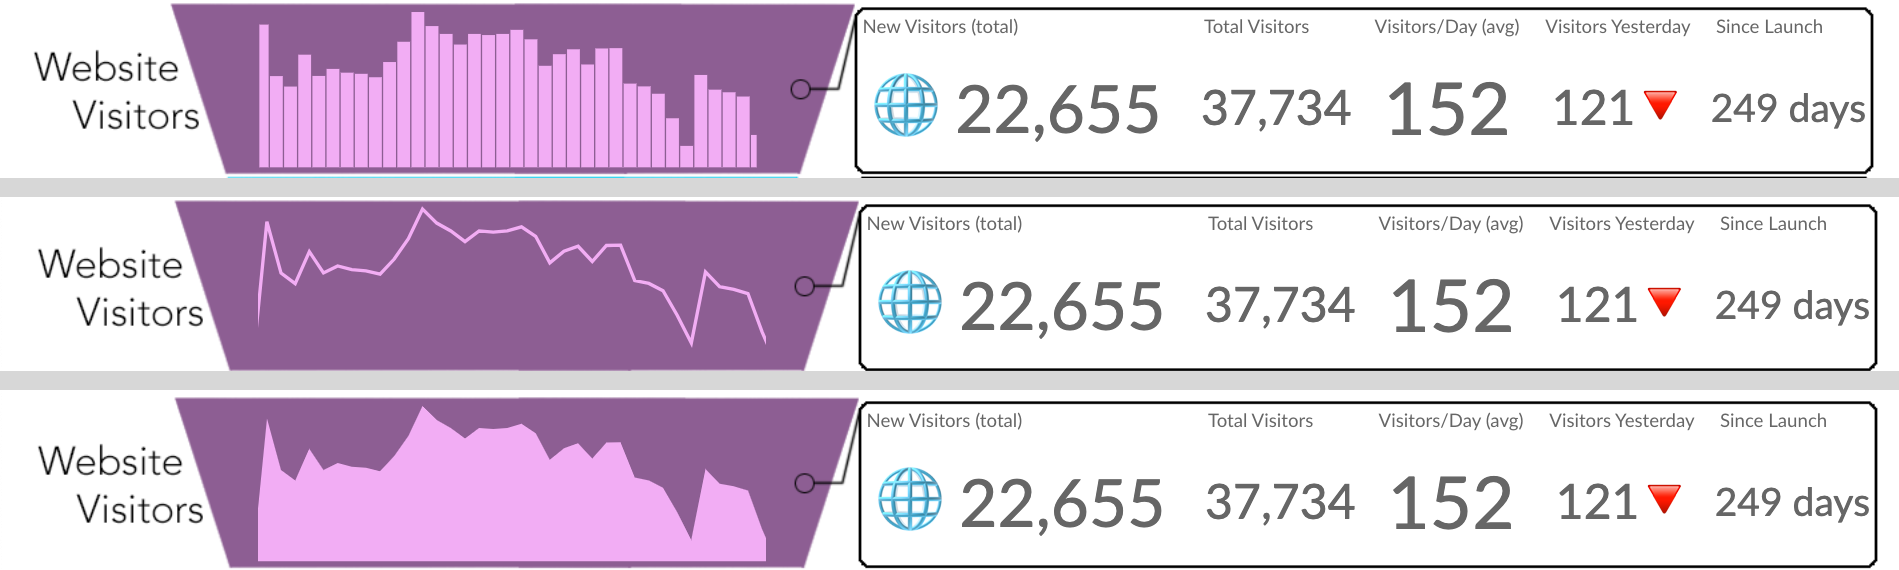
Each style option can be seen in the example above.
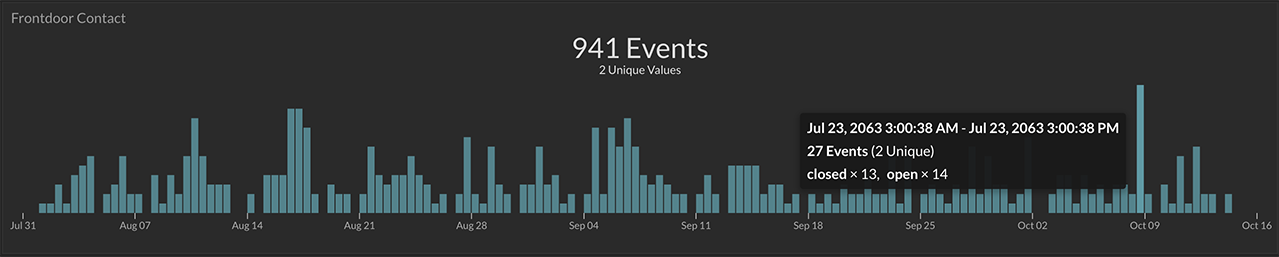
Hover
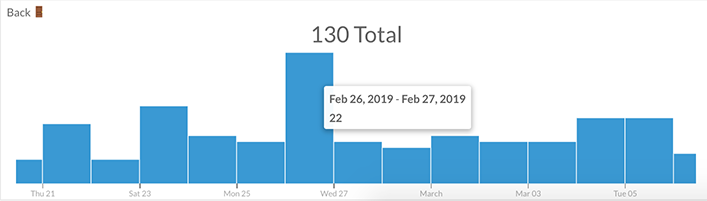
Mouse hover will popup a summary of that particular bin. The summary will contain the date range and either the count of events or the sum of the events (set in the Comparison Option).
Color Options
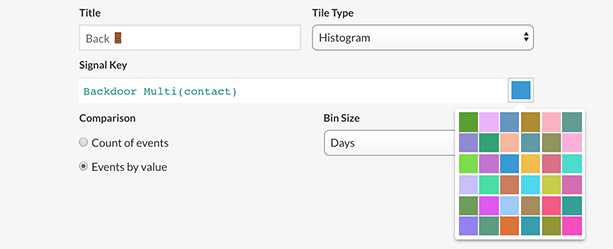
The color of the histogram can be set using the color picker icon on the right of the Signal Key field.