Data View Type - Line Graph
Tile Configuration
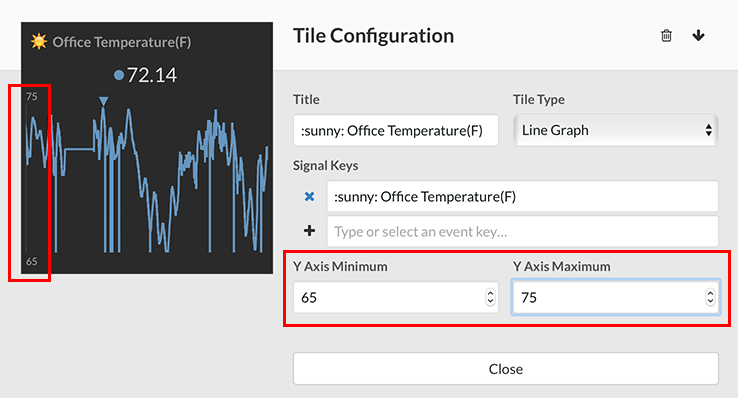
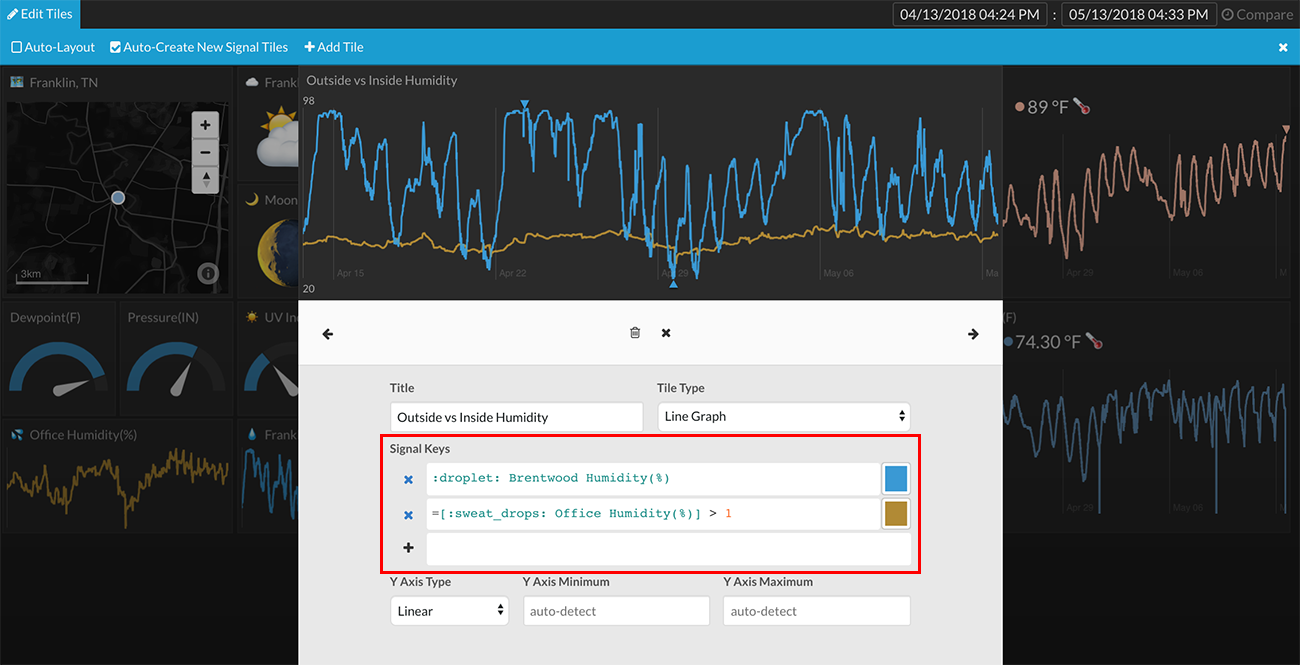
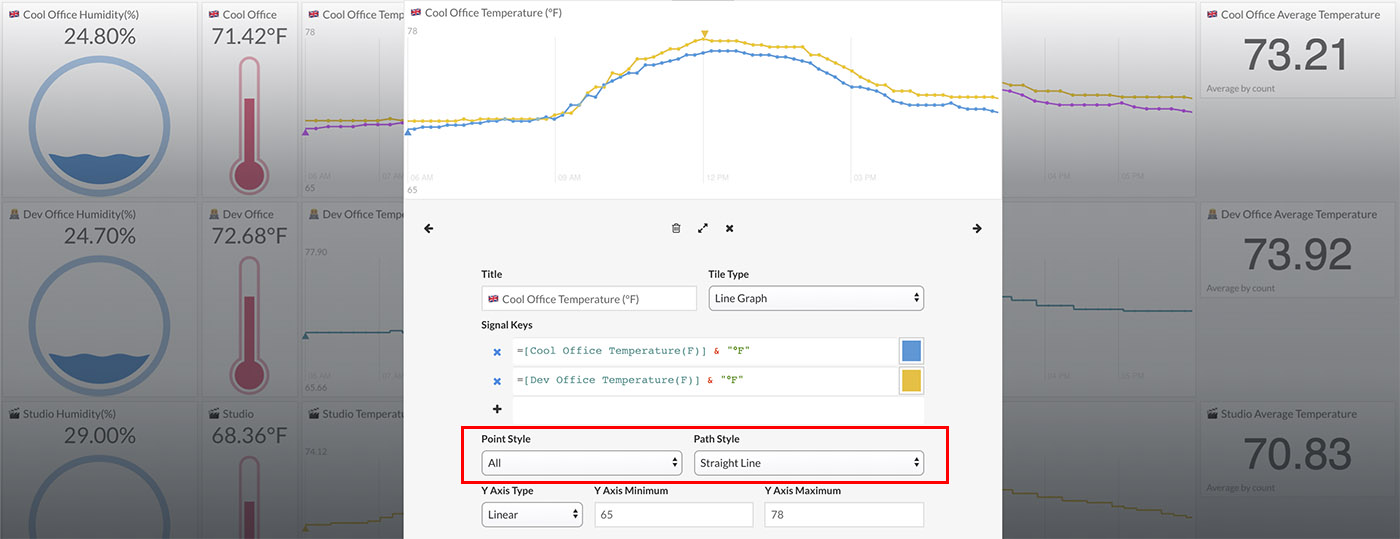
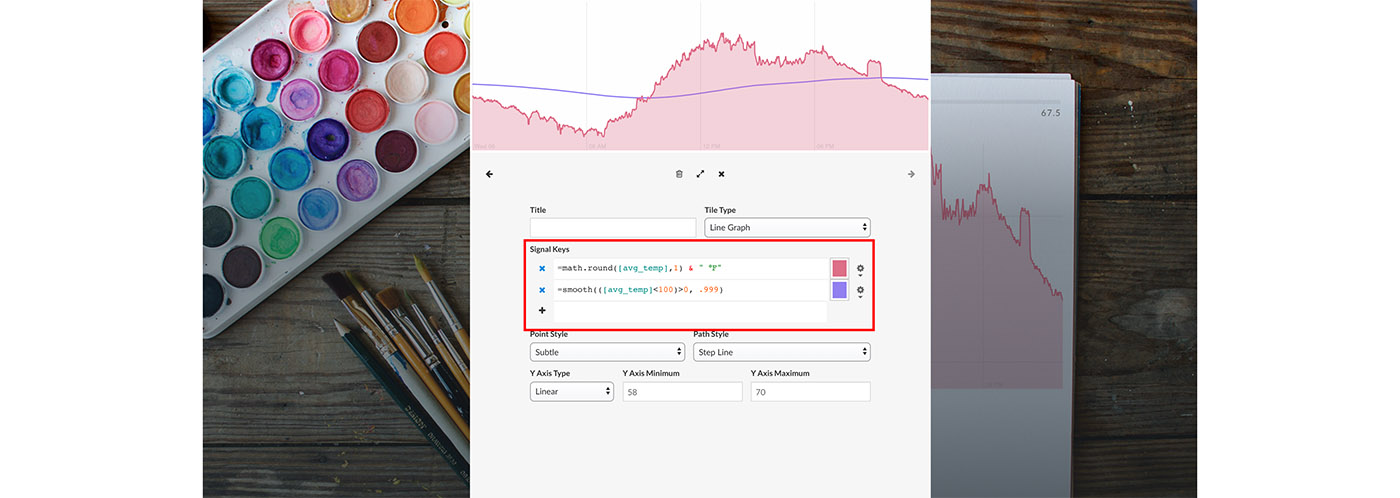
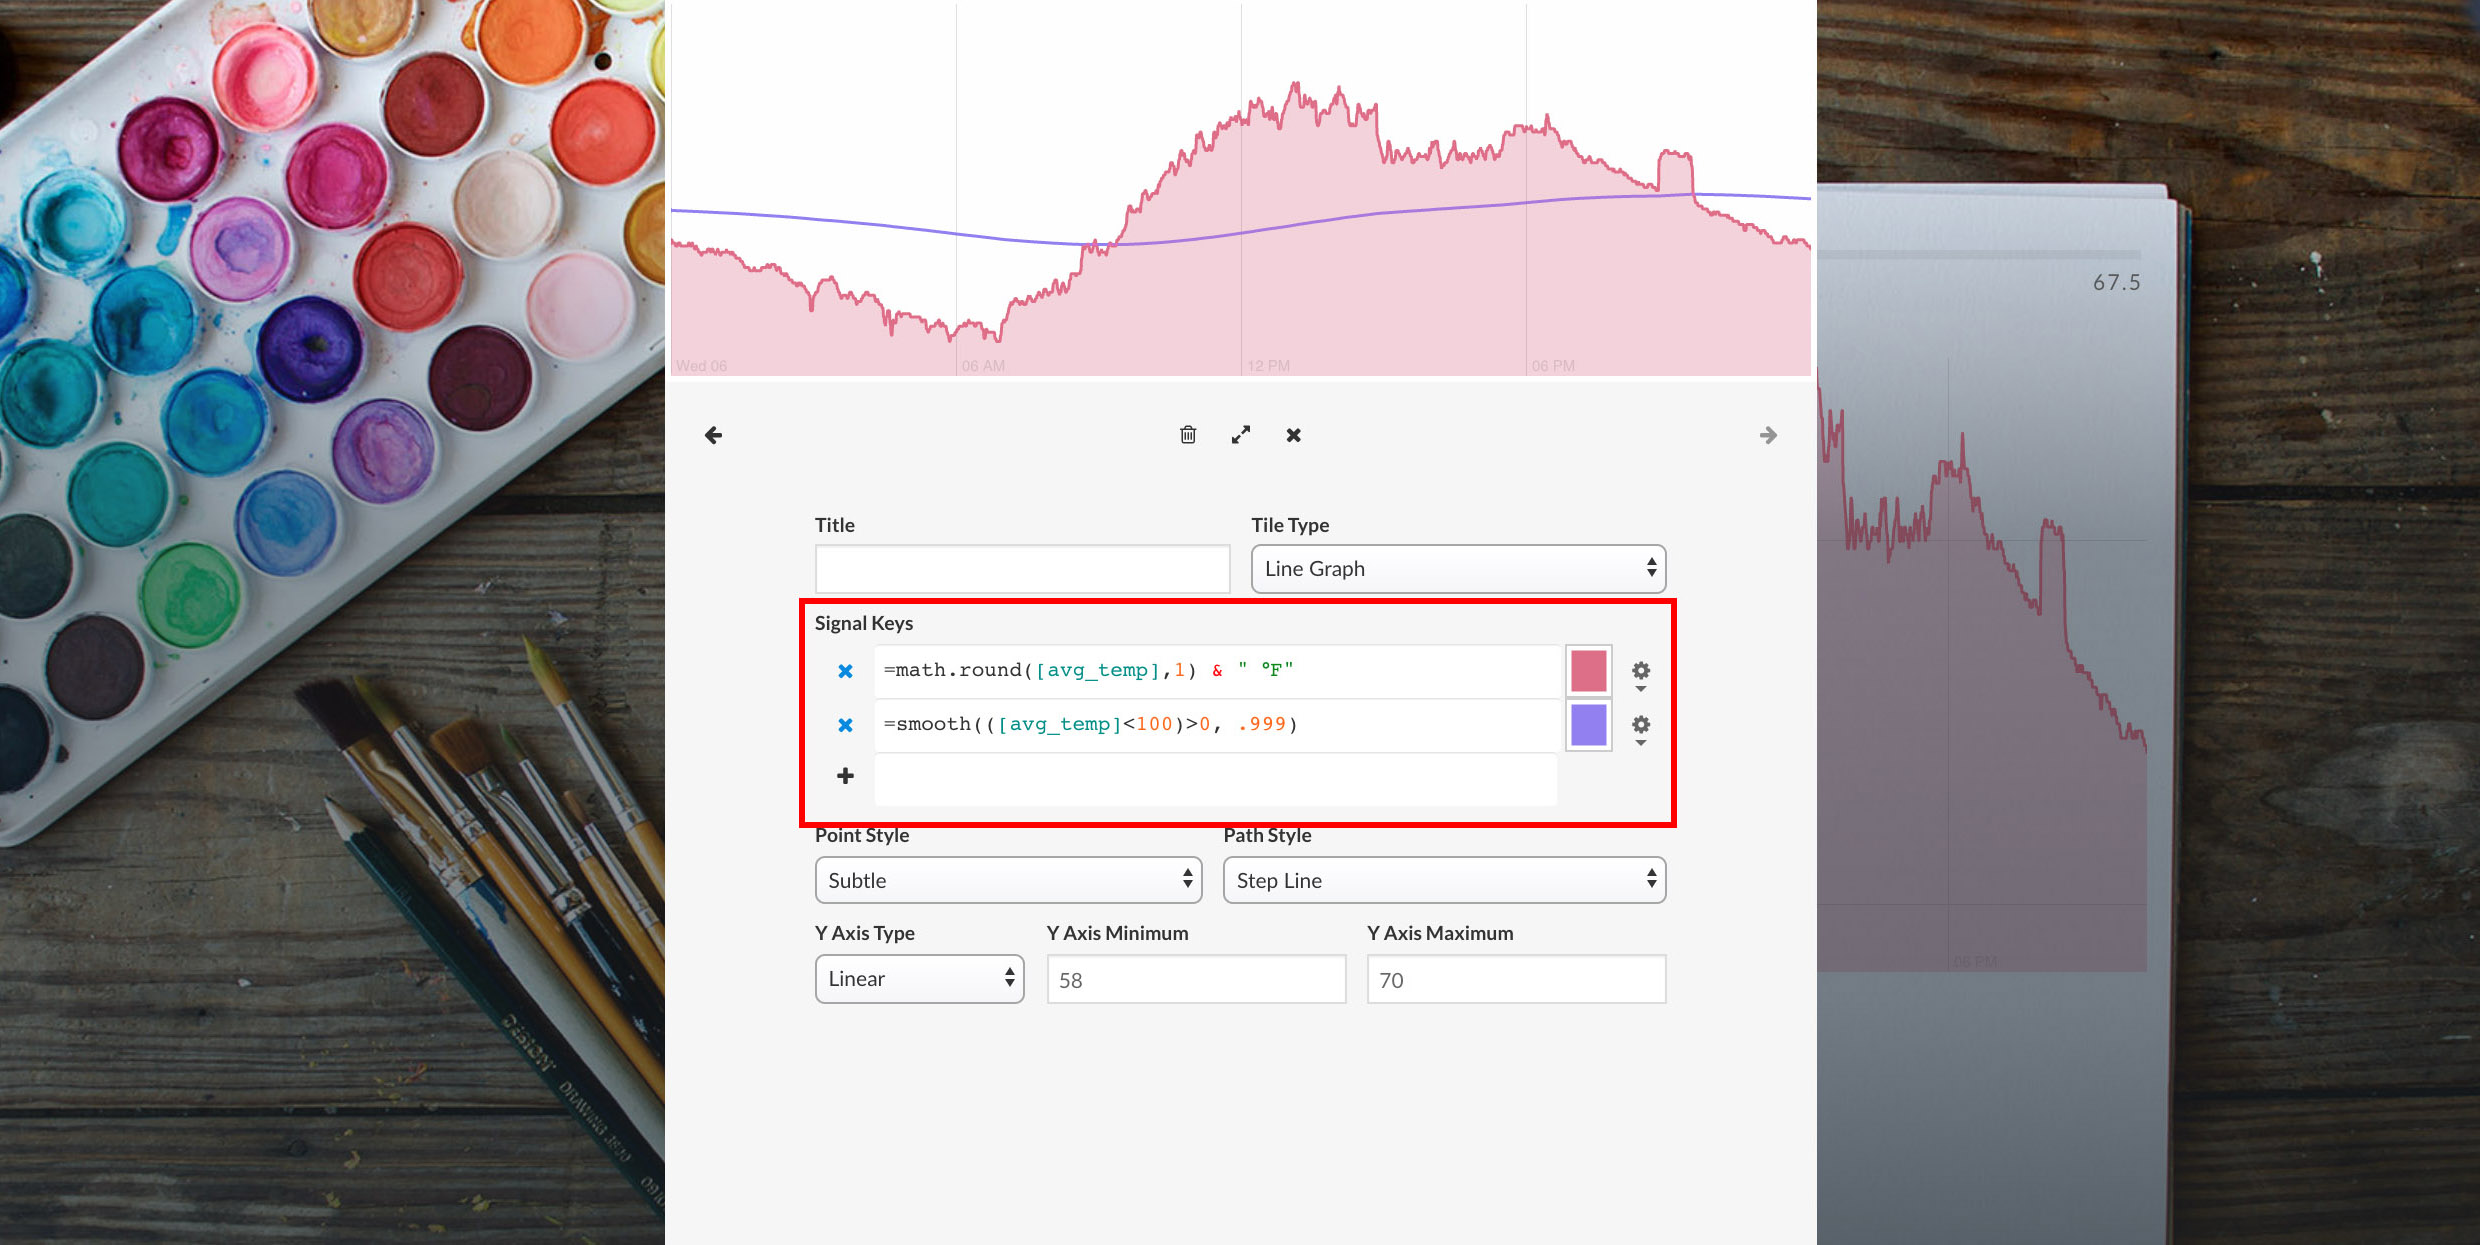
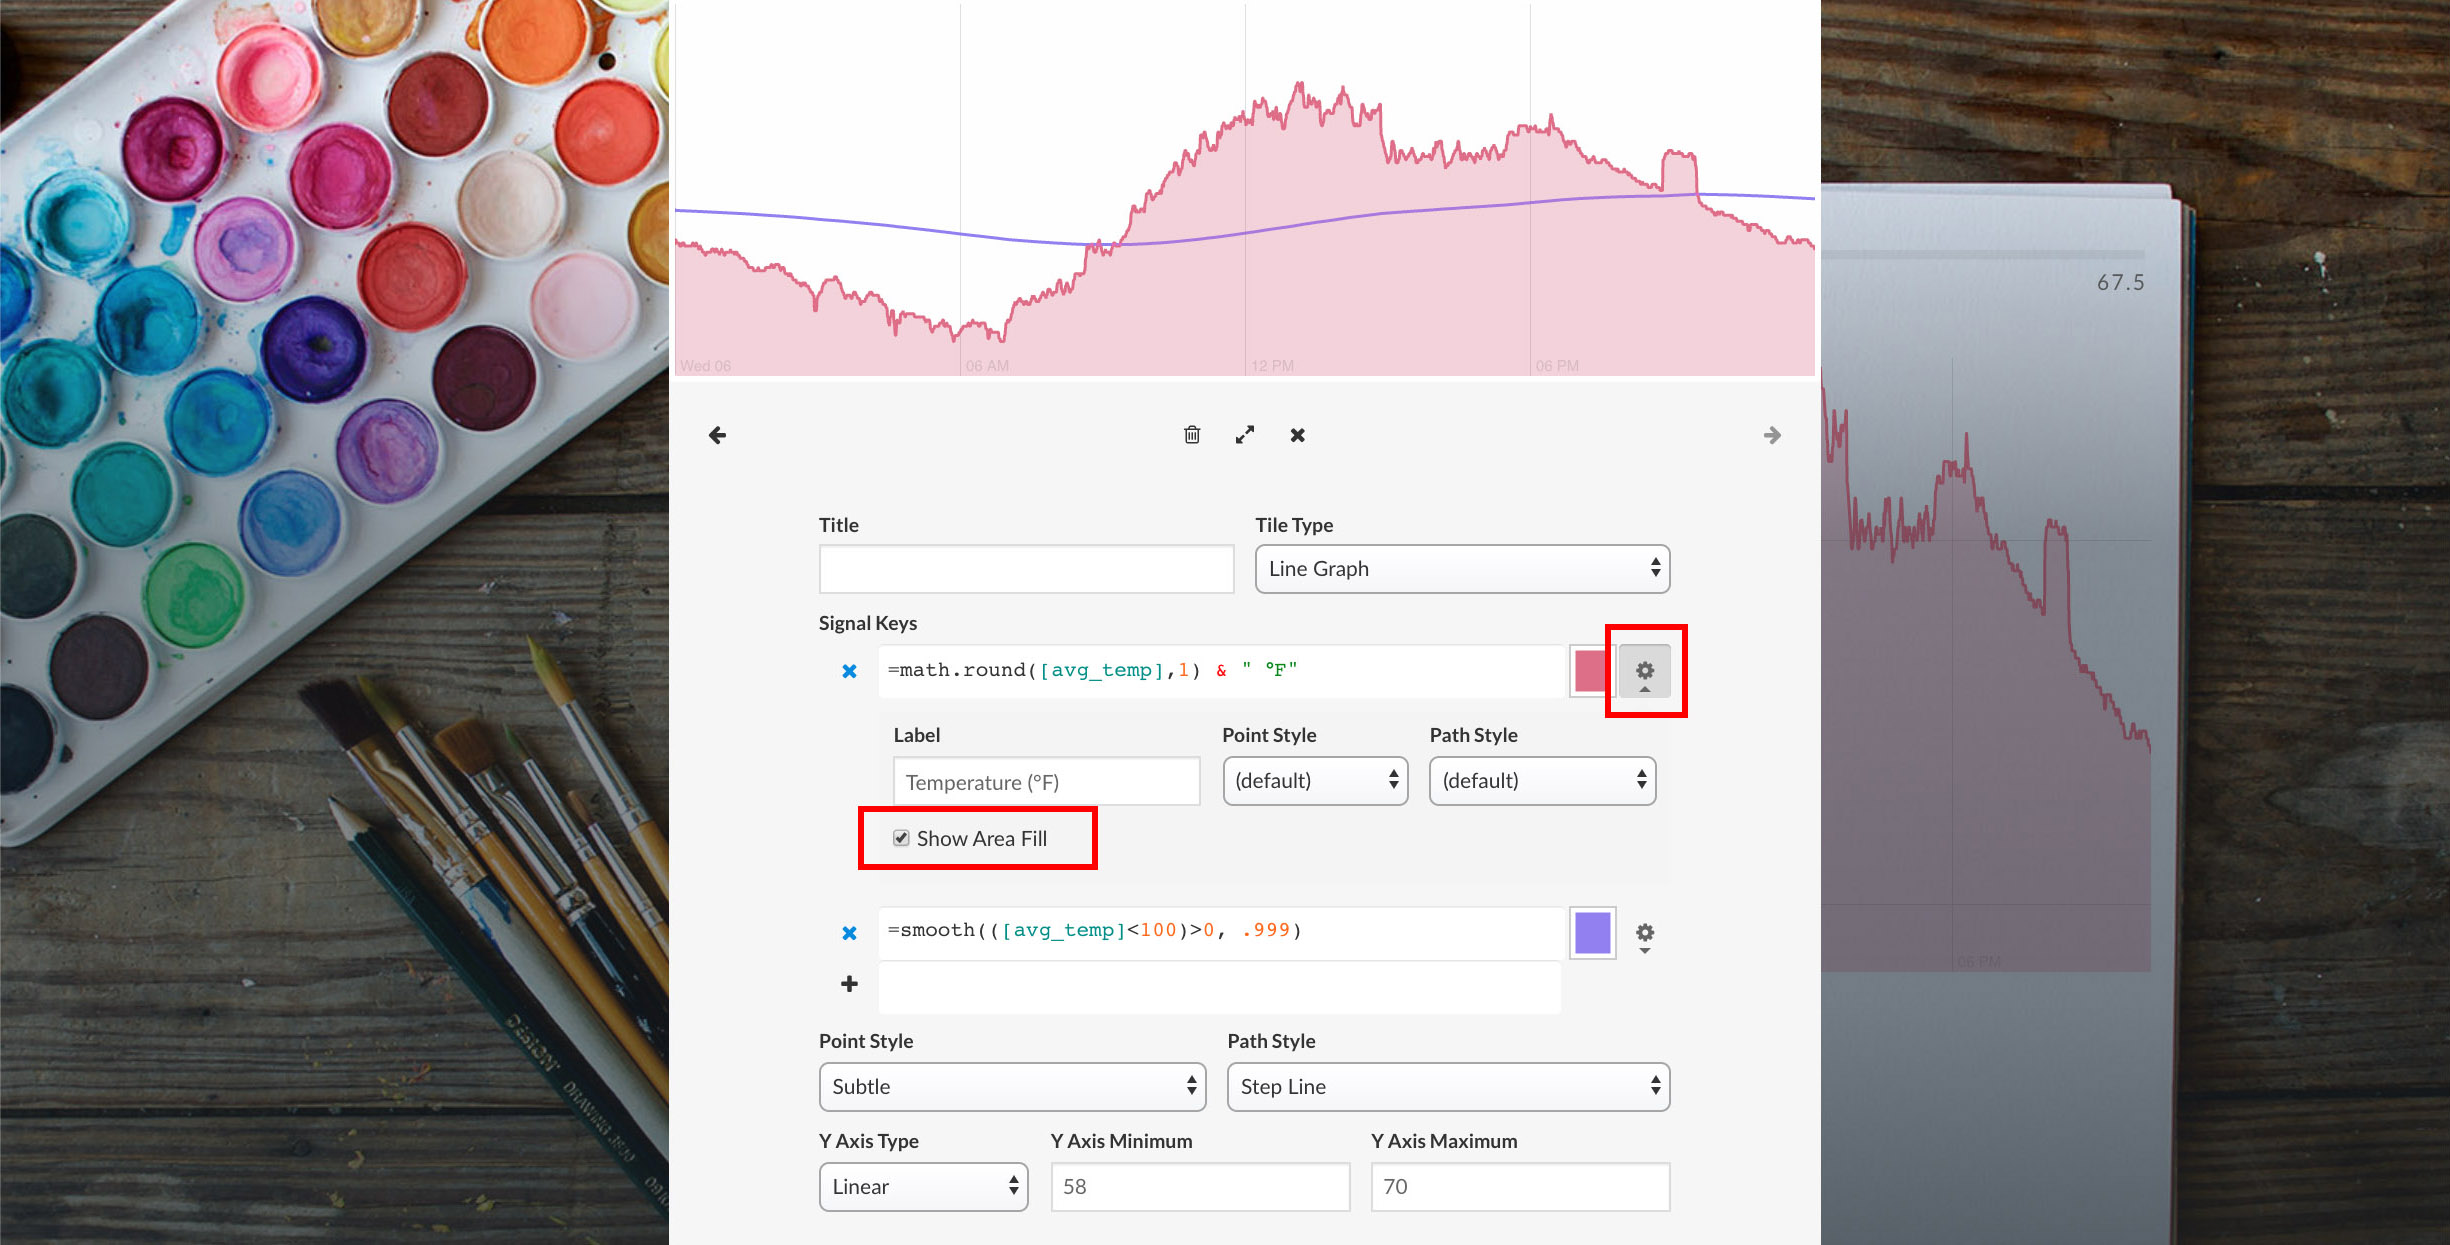
The line graph tile type settings can be set in the Tile Configuration (right-click on tile -> Edit Tile).

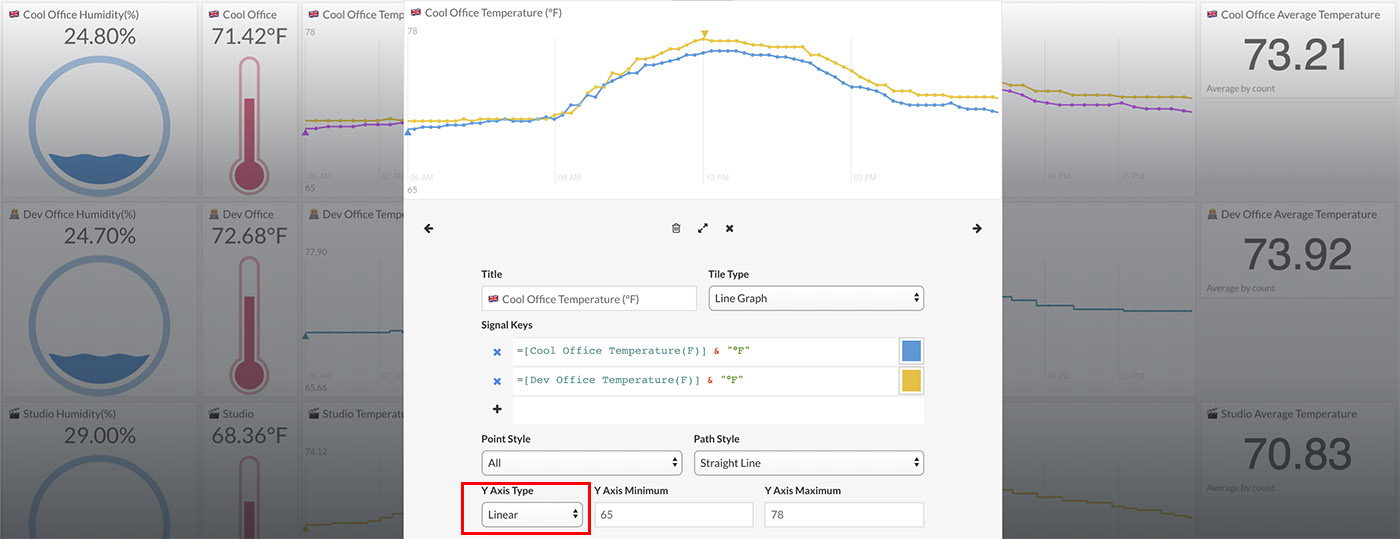
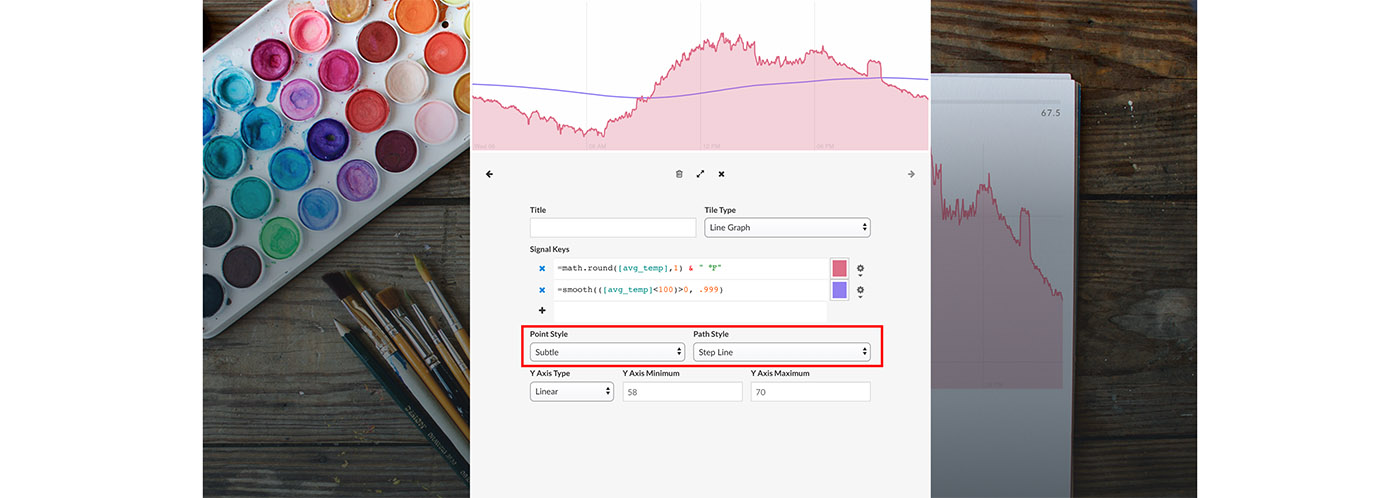
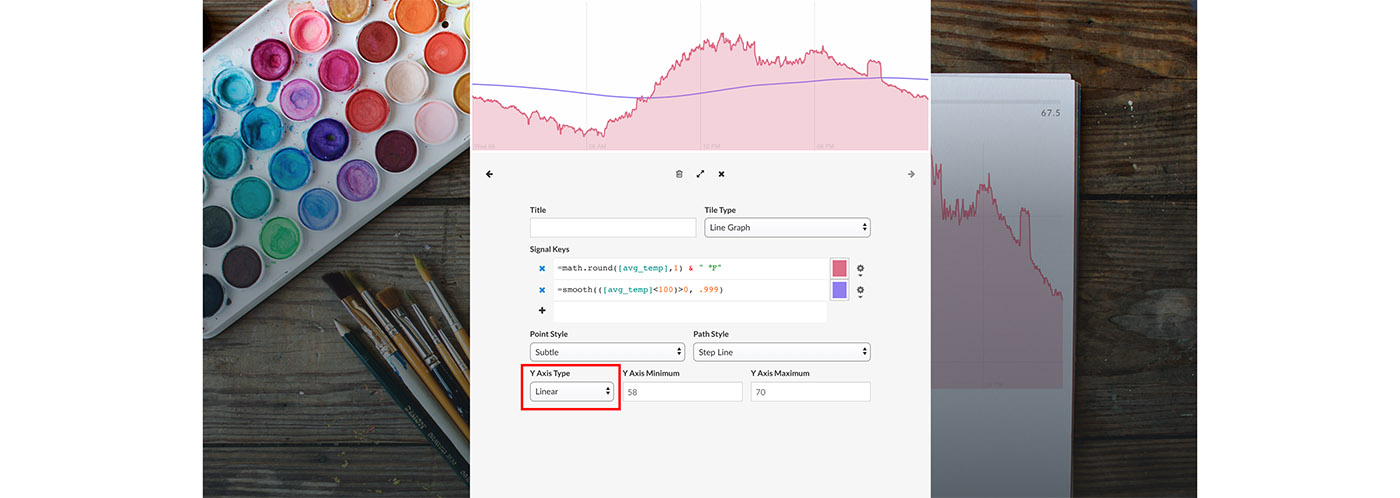
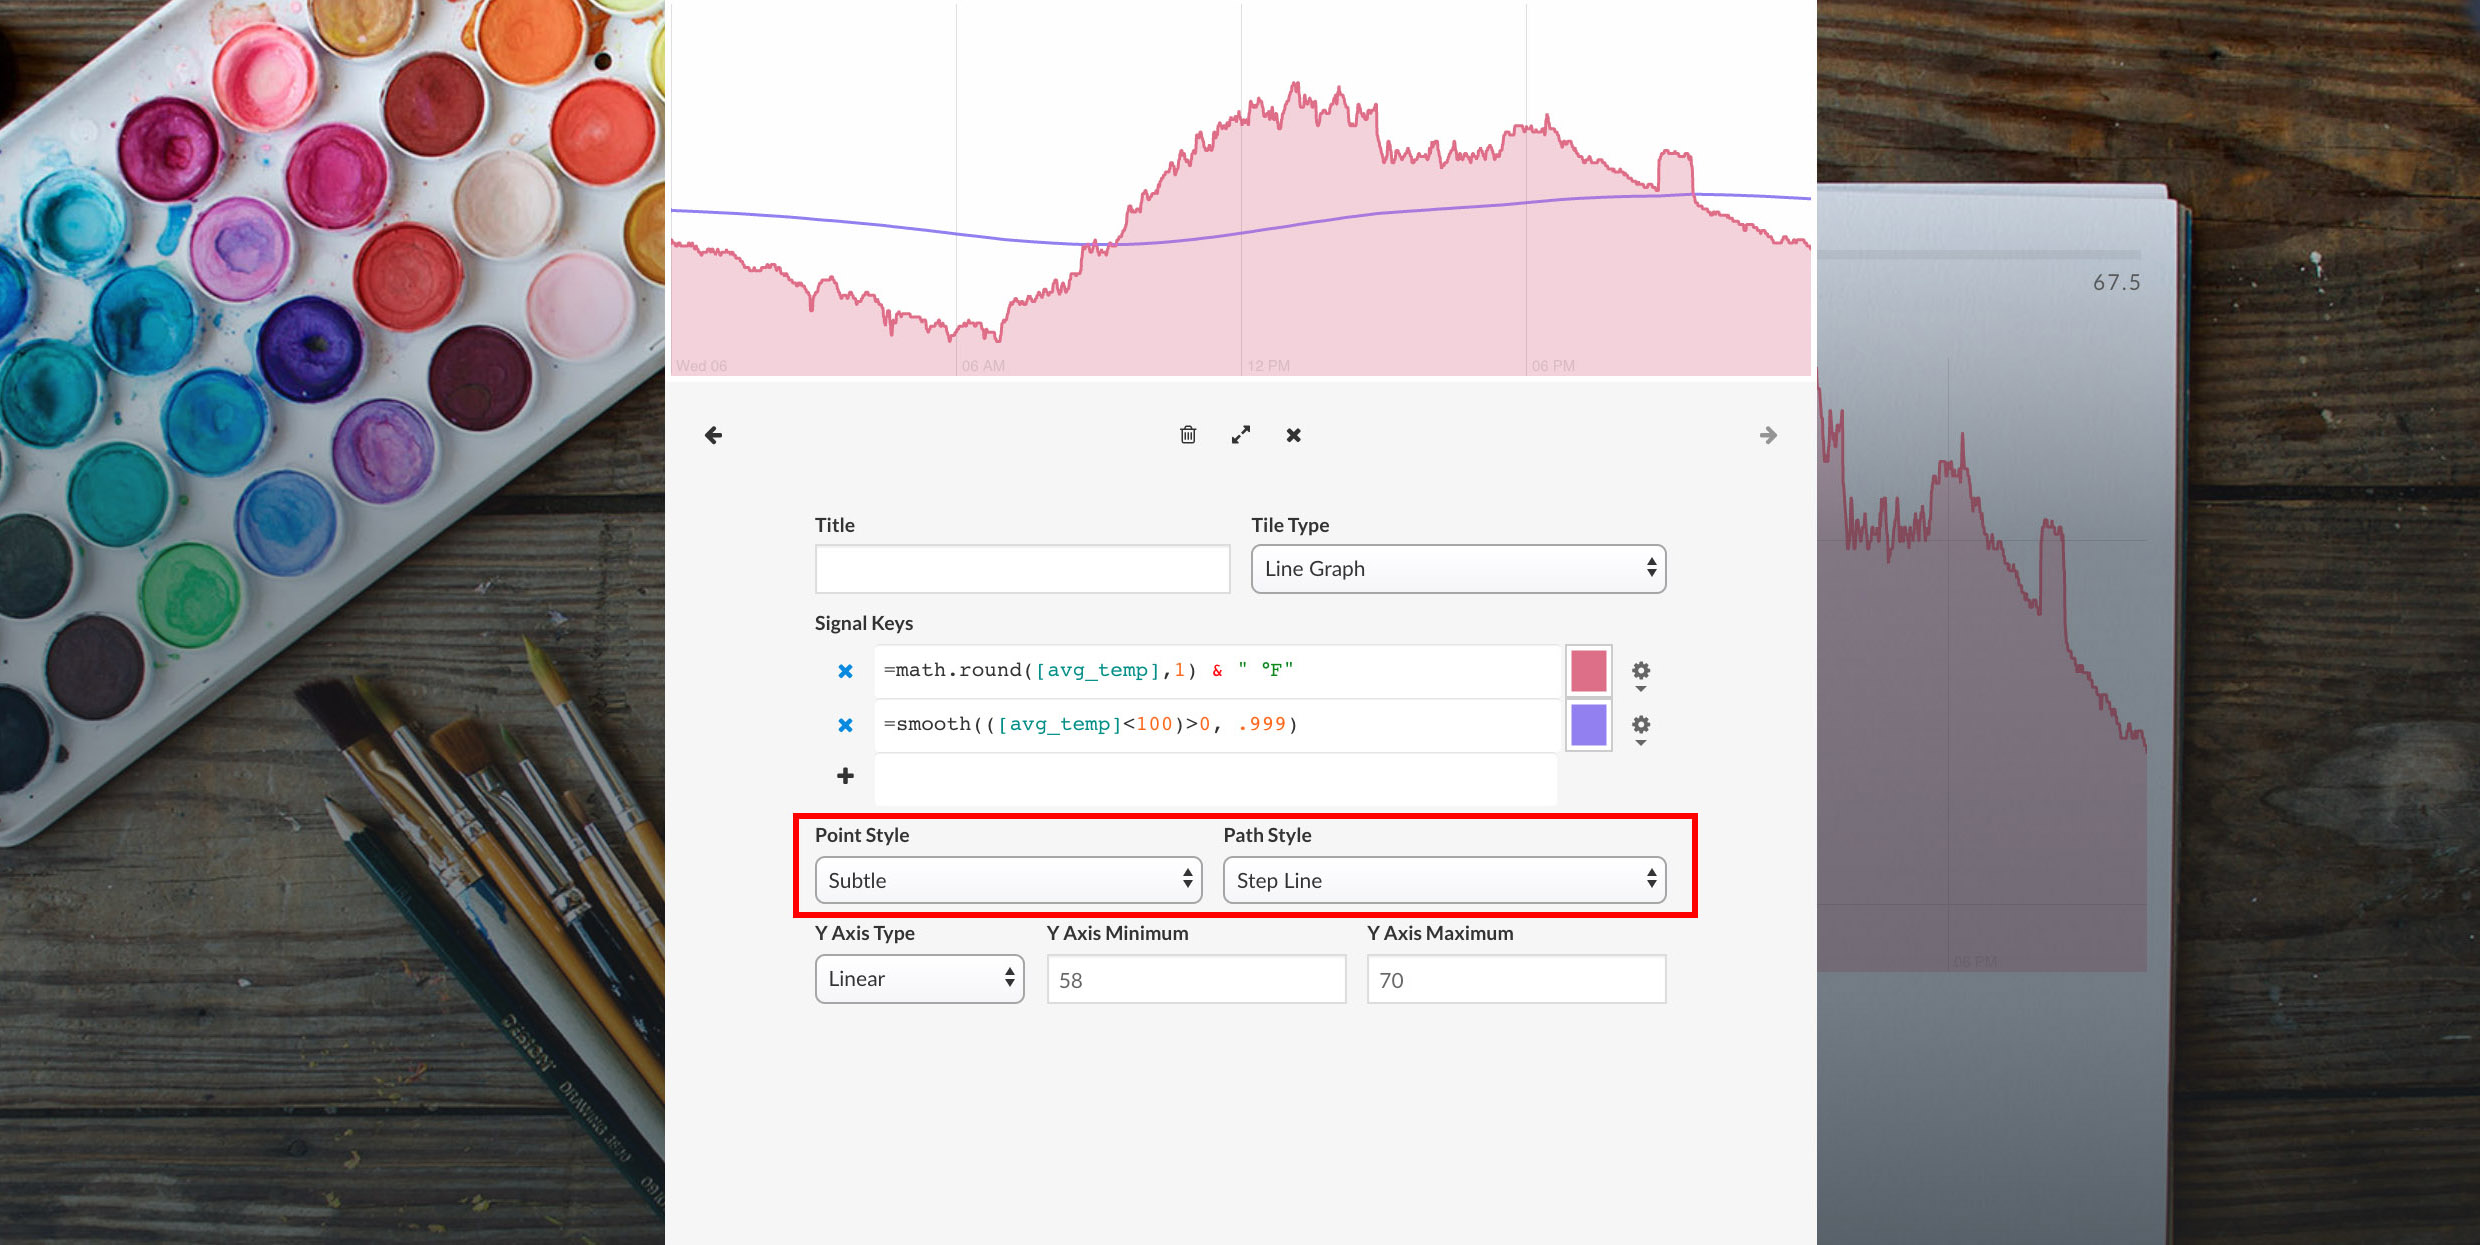
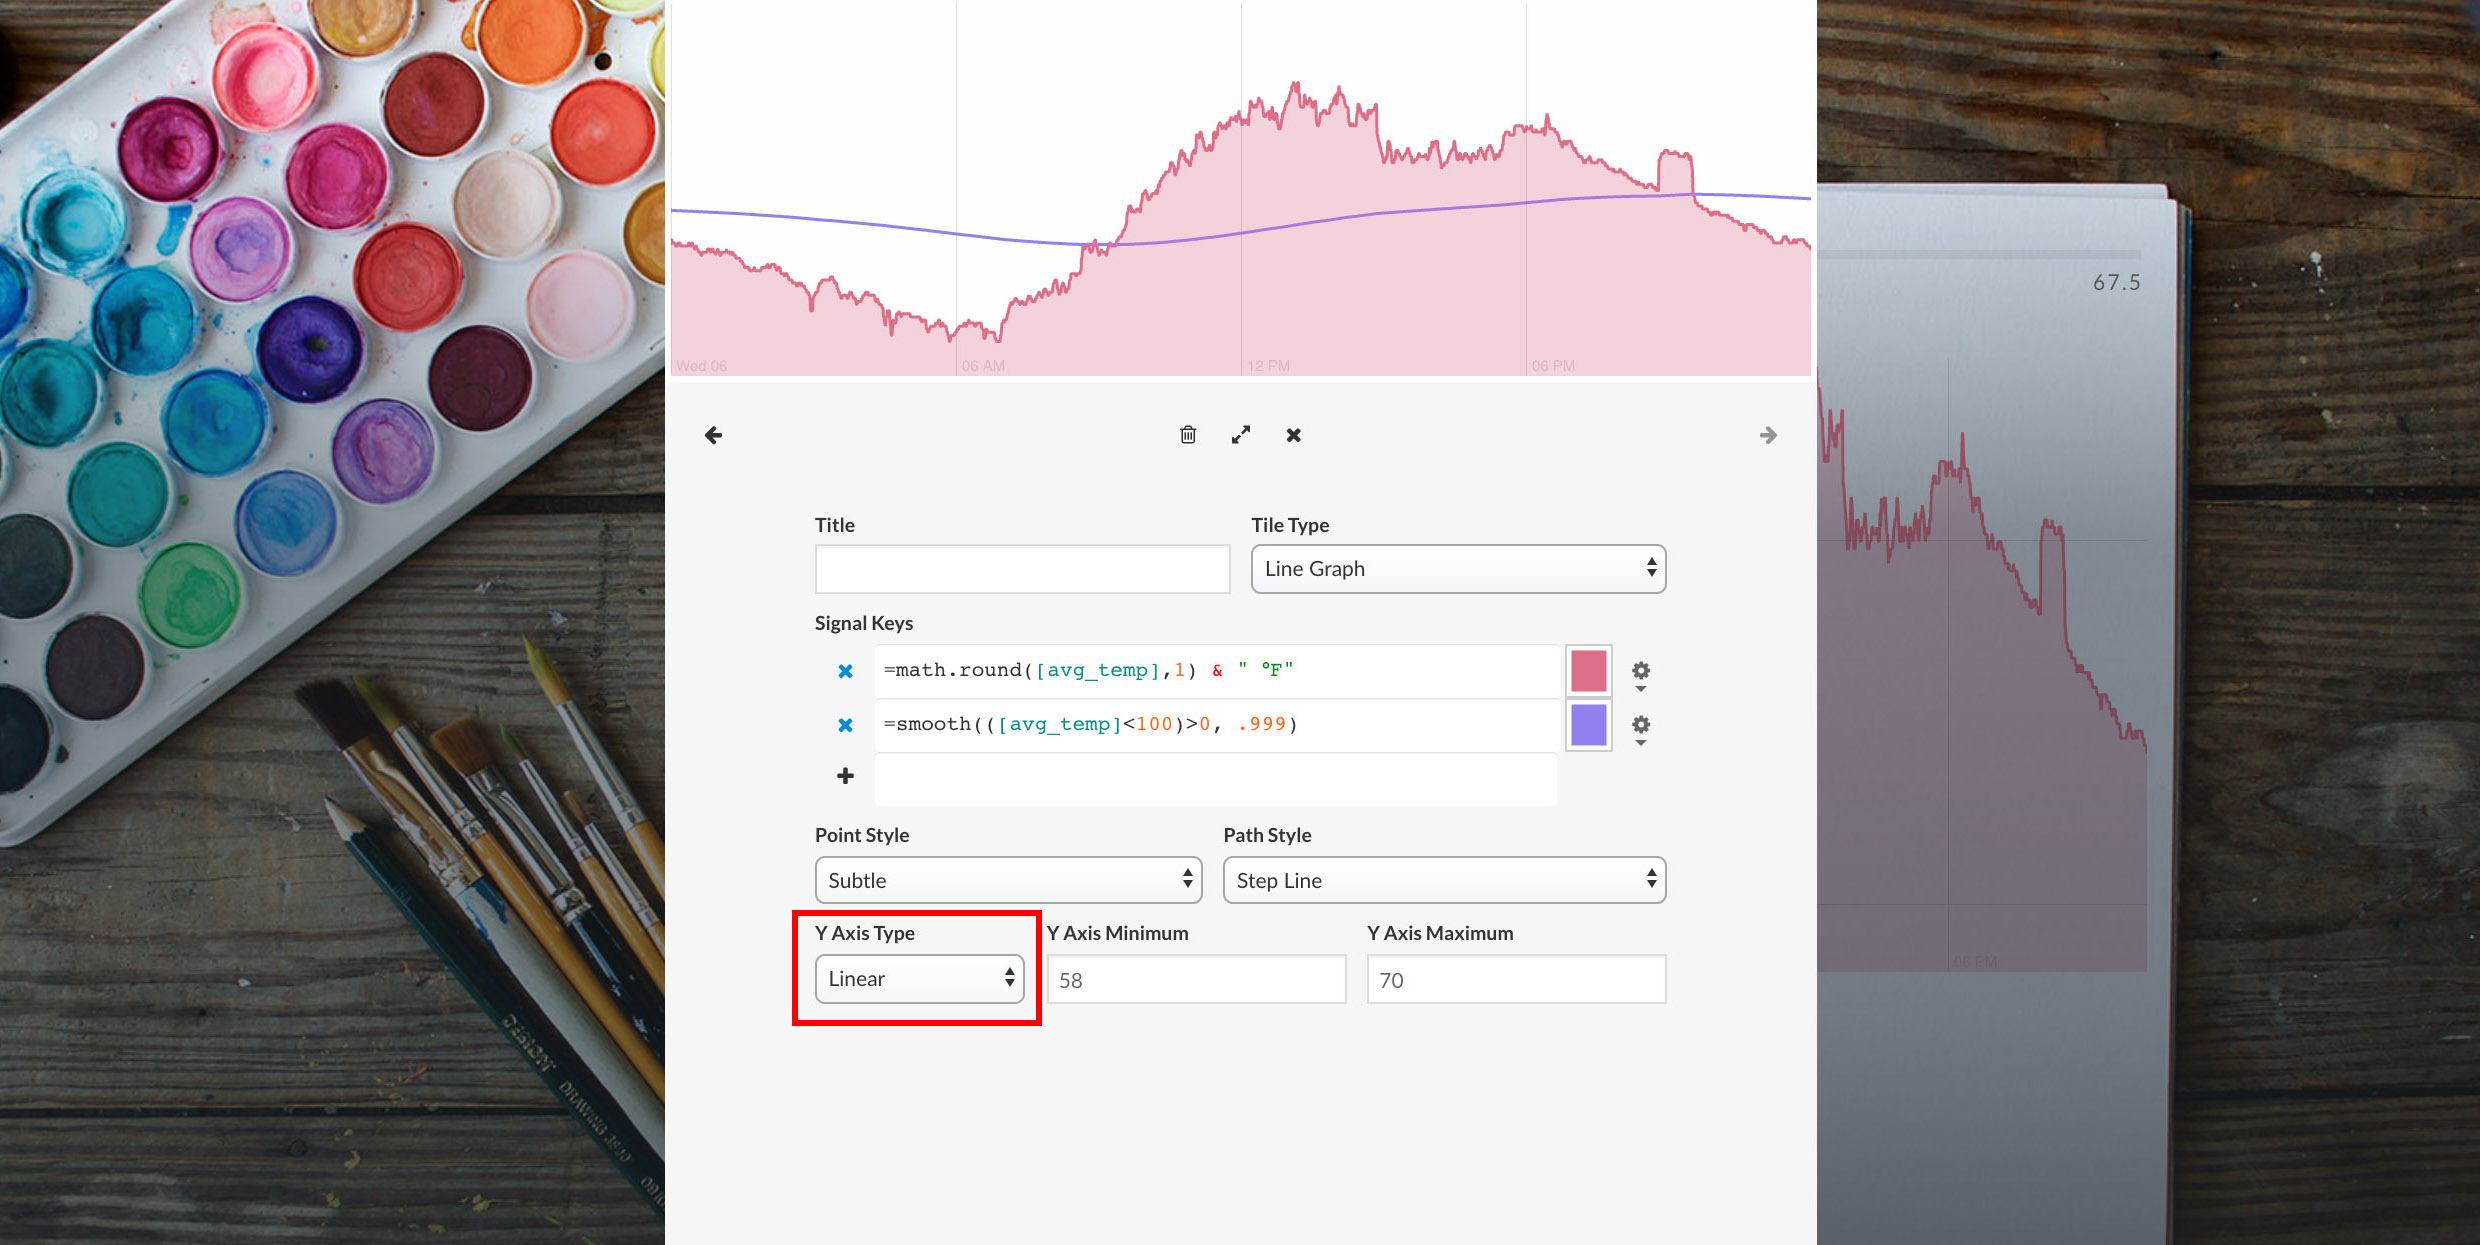
The line graph type can be specified using the Point Style and Path Style drop down menus. Point Style options include "All" (show medium-size circles for each data point) and "Subtle" (show small-size circles for select data points). Path Style options include "Straight Line" (draw a straight line between data points), "Step Line" (draw a stair-step between data points), and "No Path" (only draw data points and no lines in between).

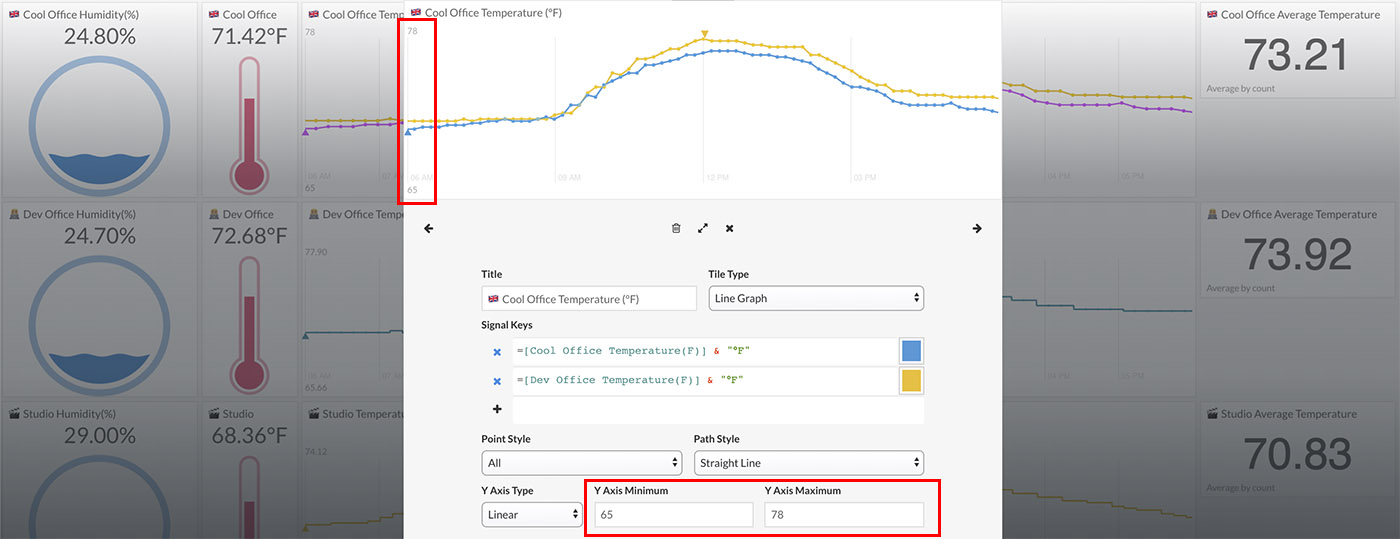
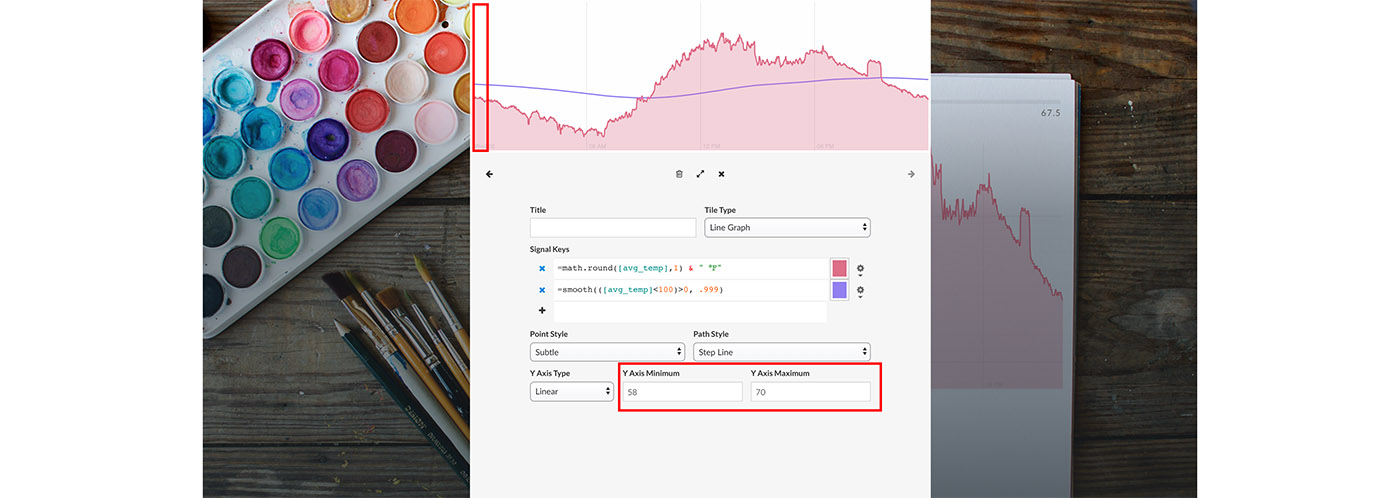
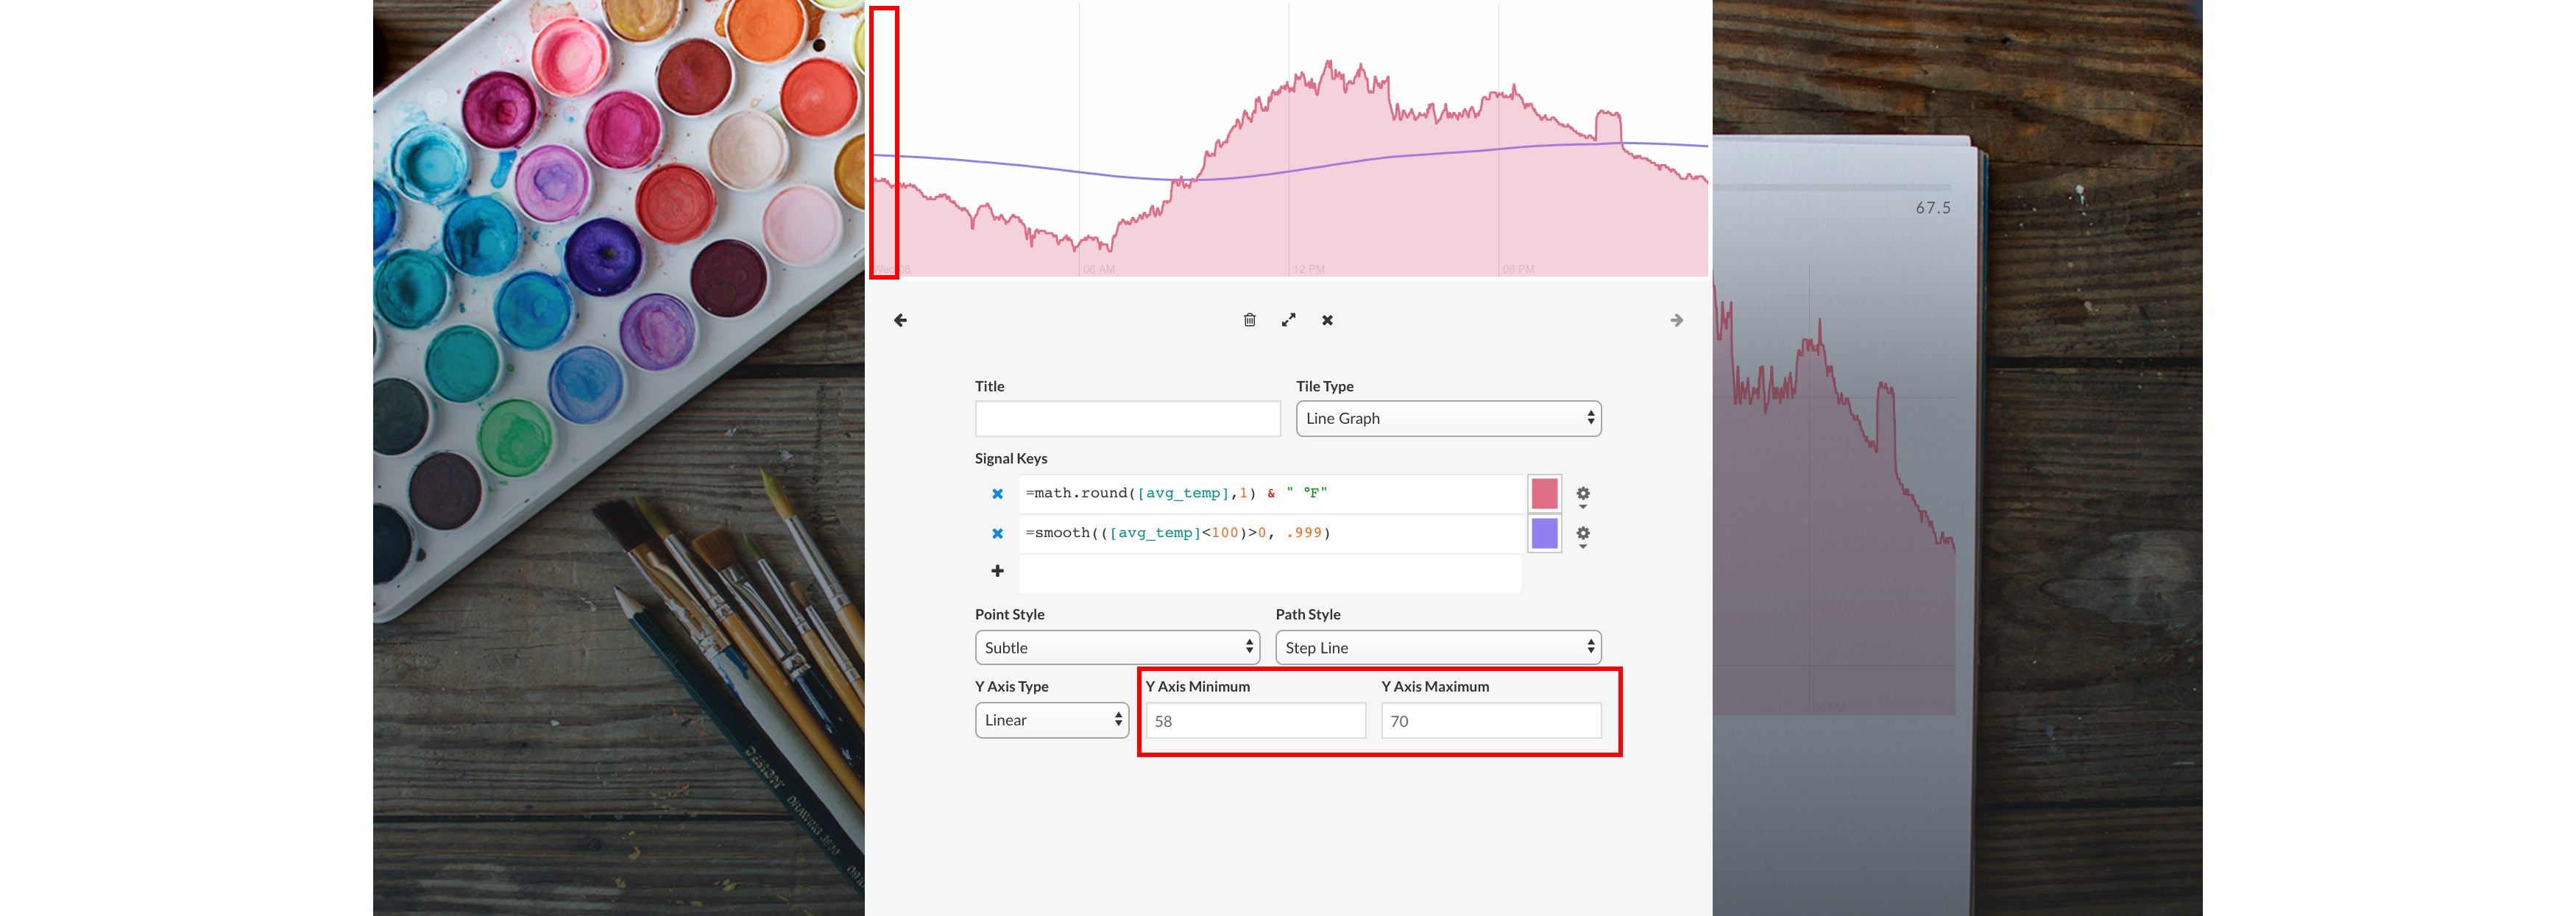
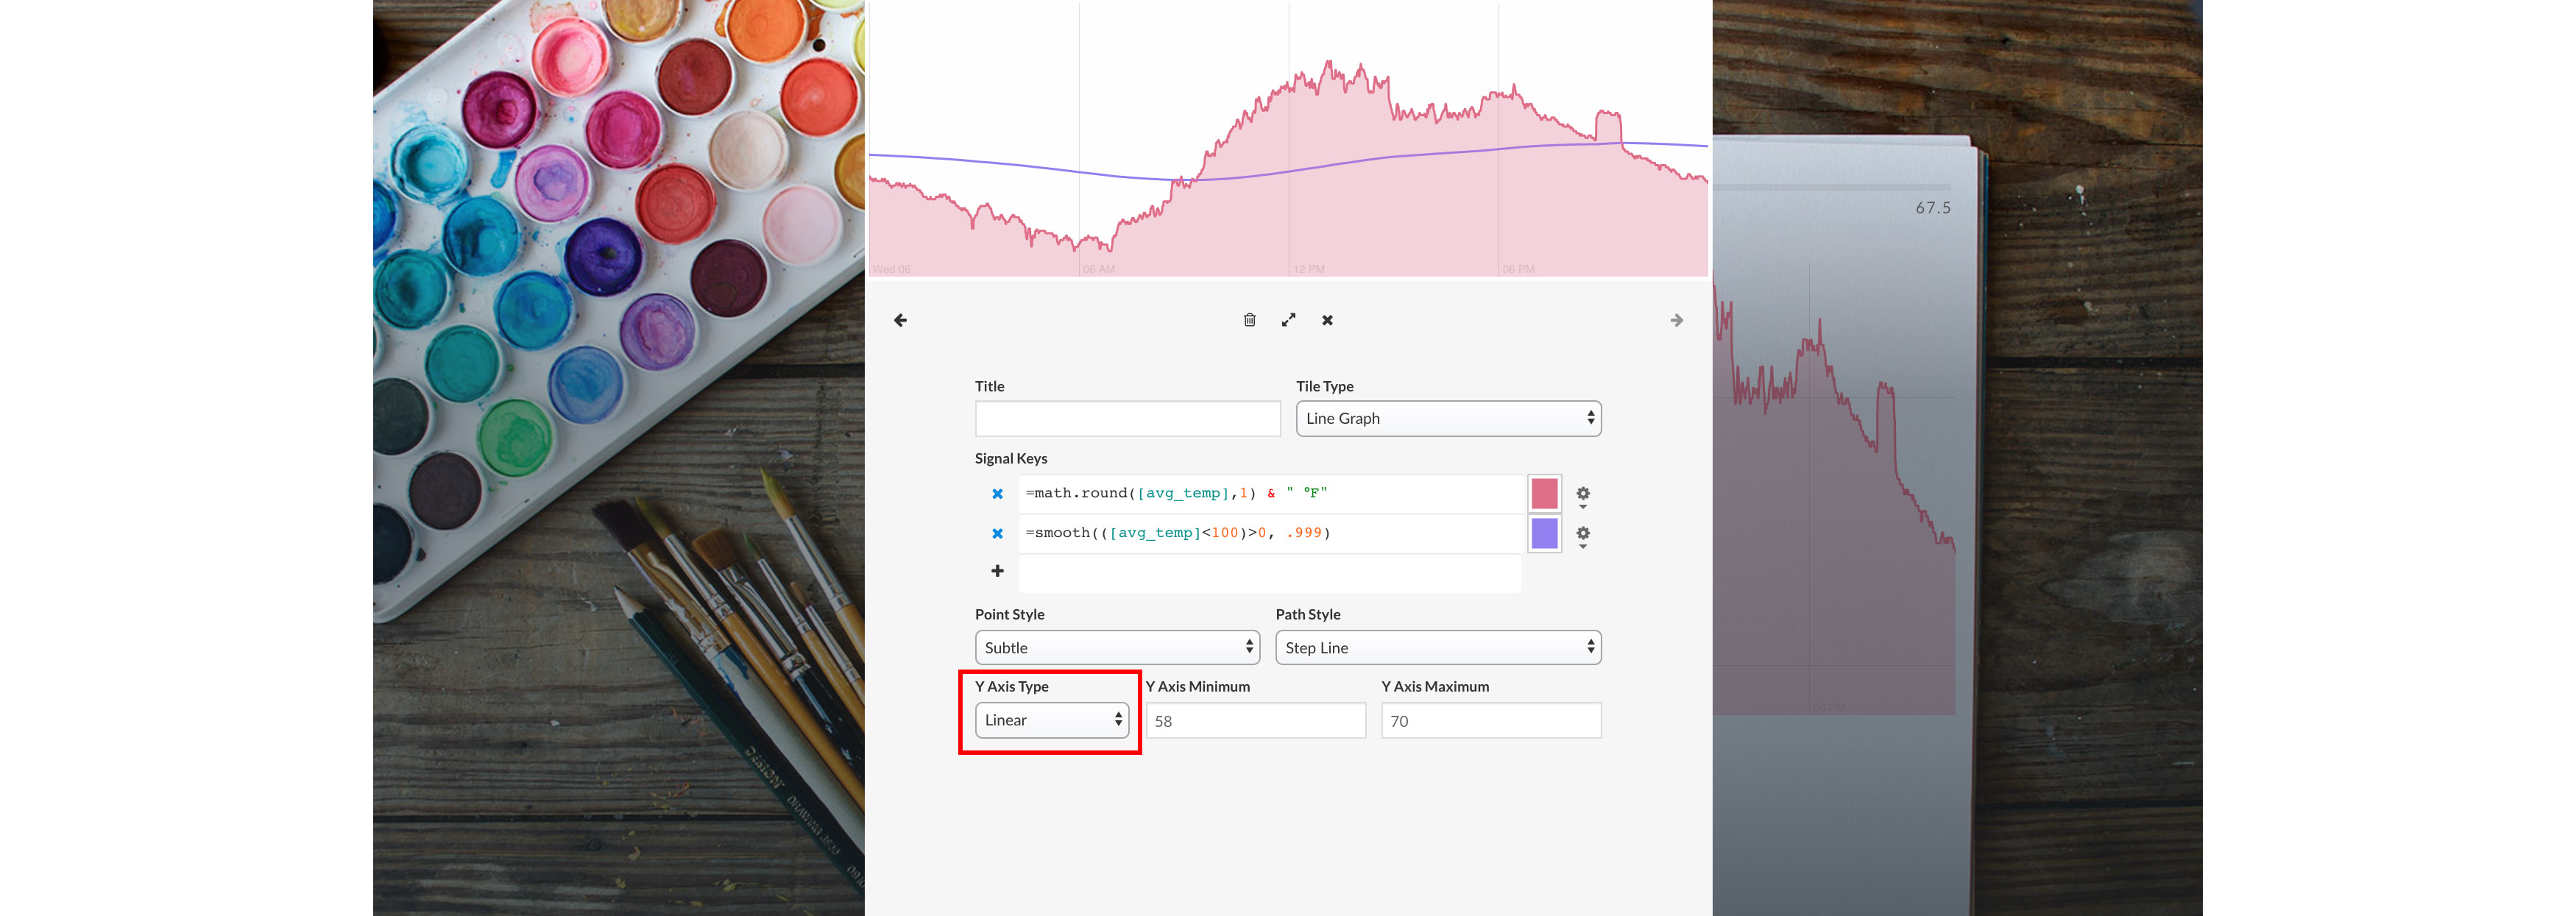
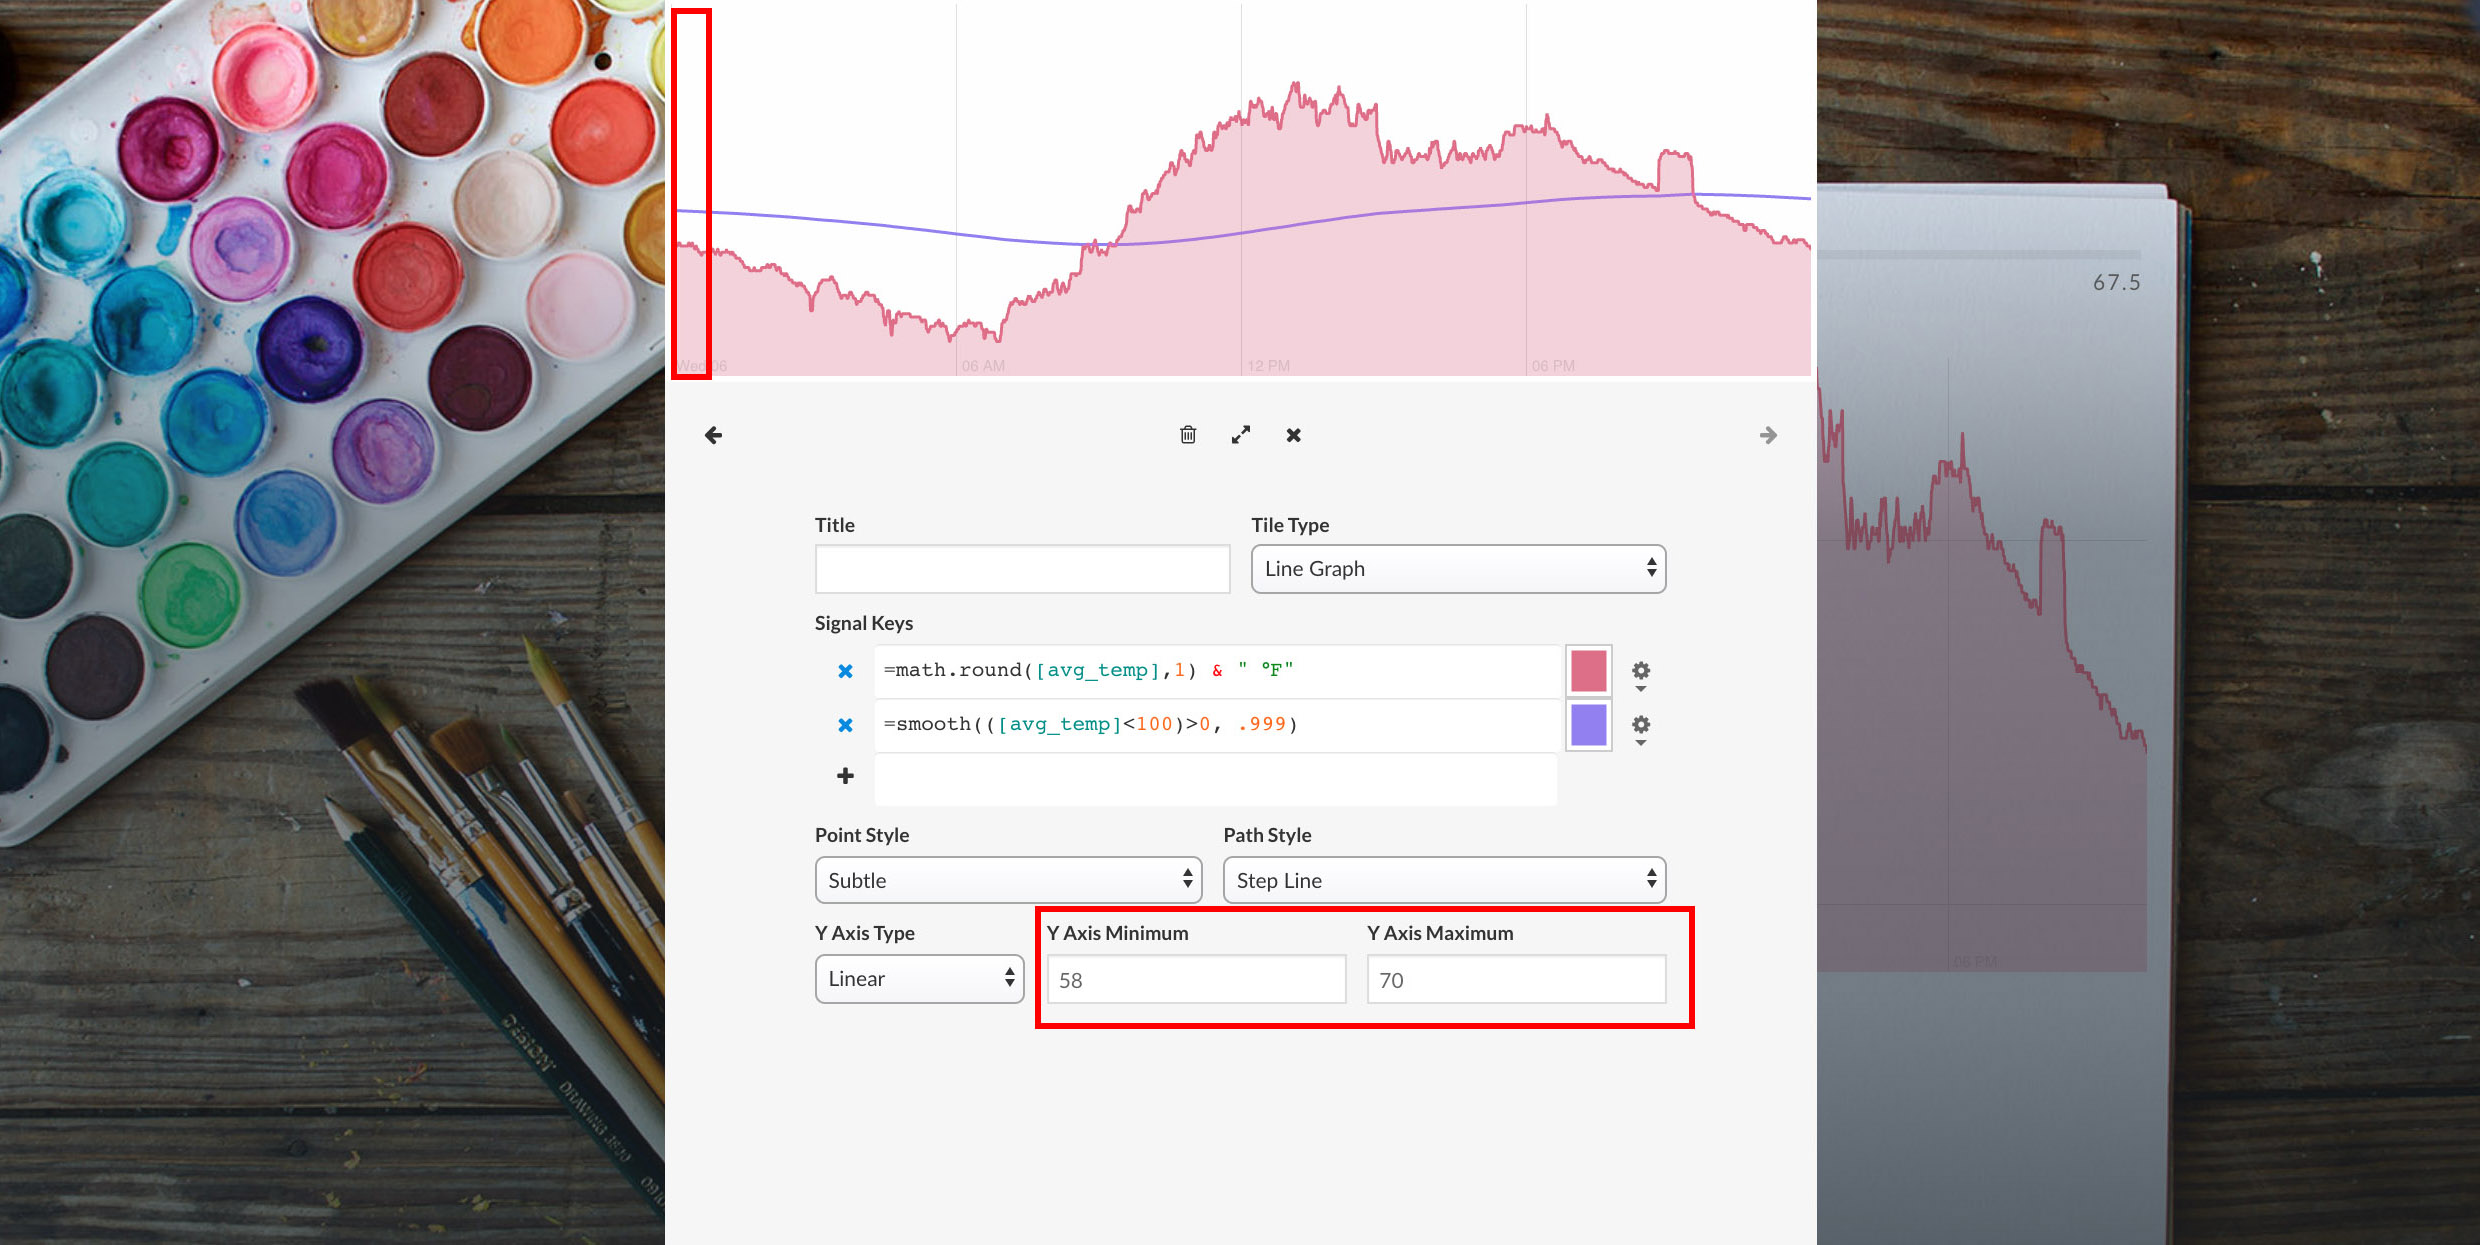
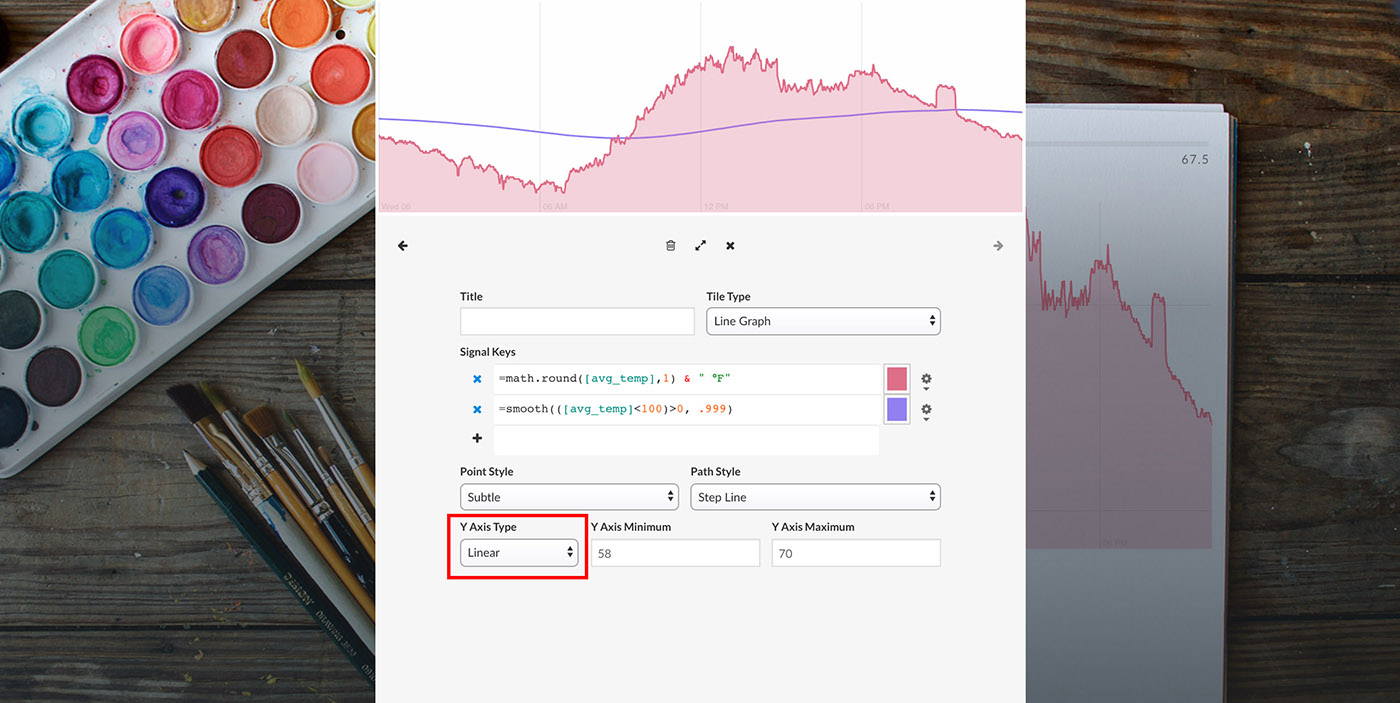
The y-axis minimum and y-axis maximum can be forced or auto-set.

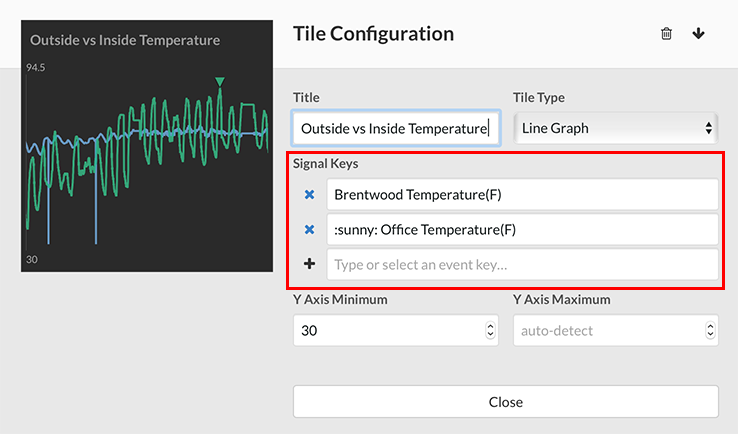
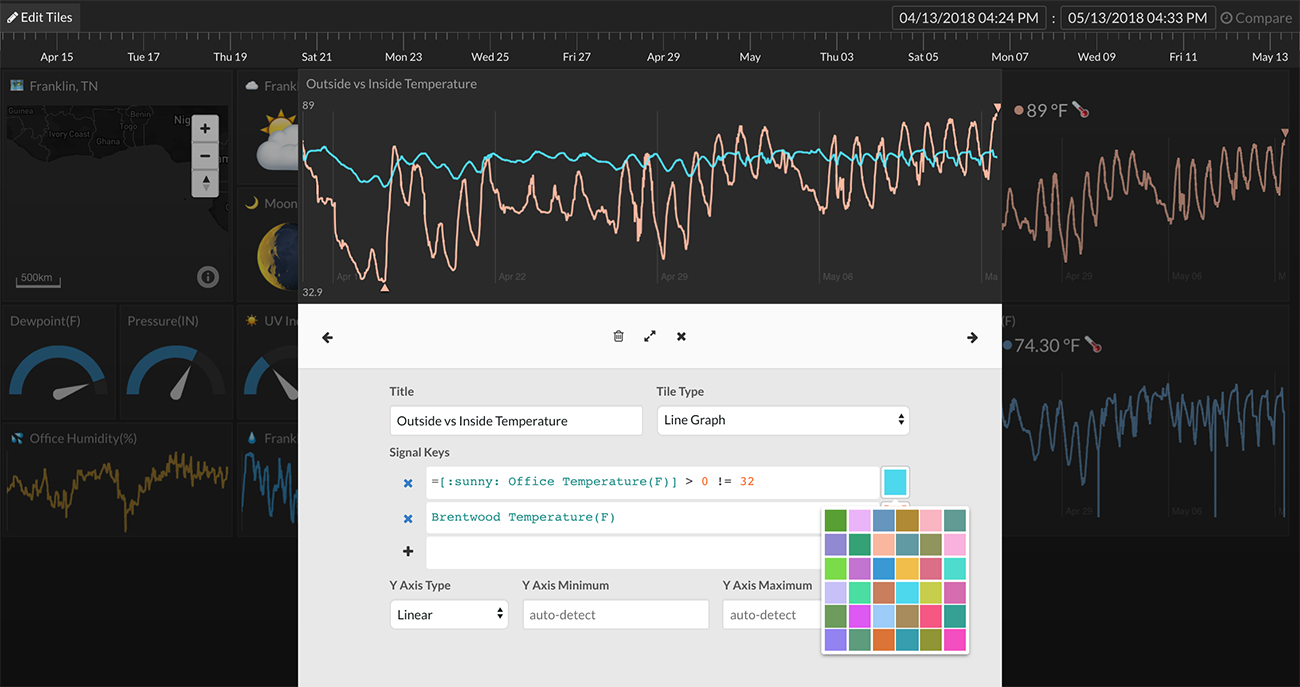
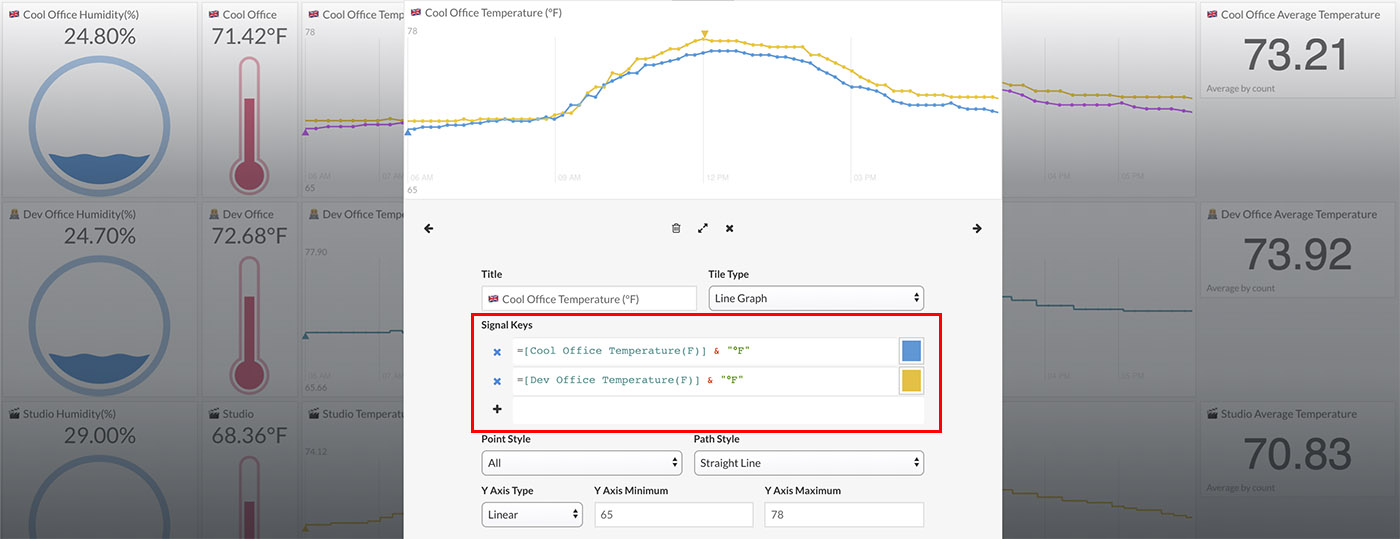
Multiple signals can be placed within a single line graph view tile using the Signal Keys section.

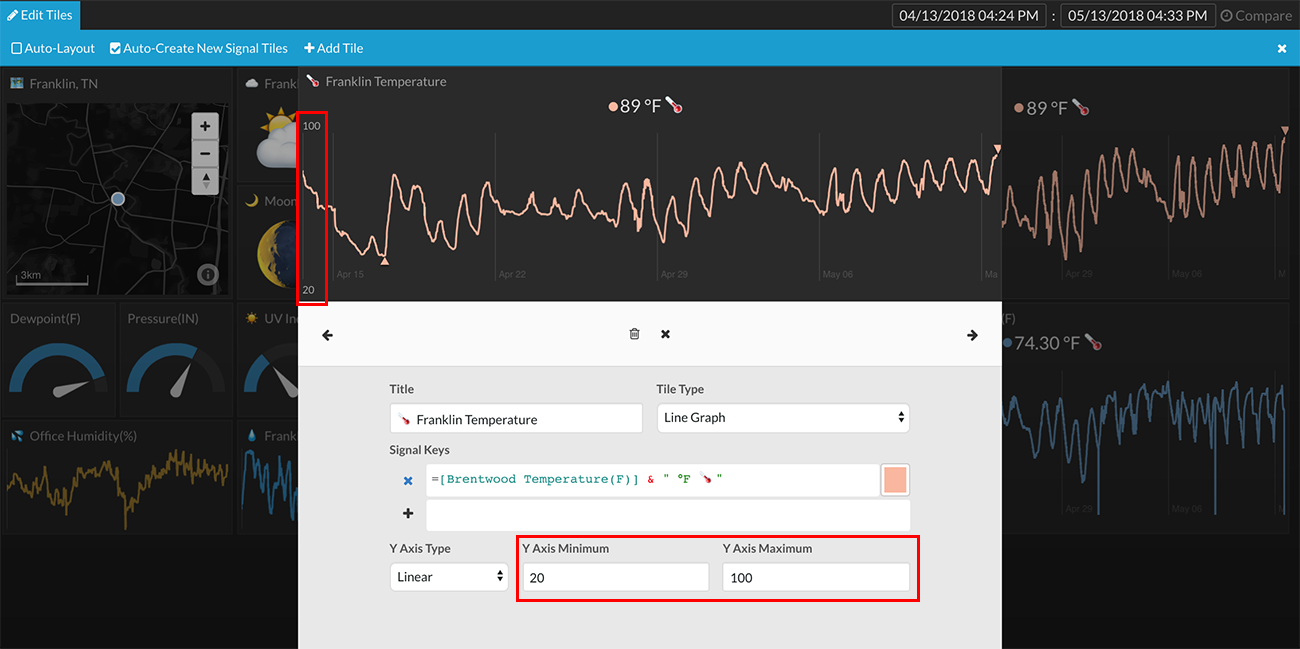
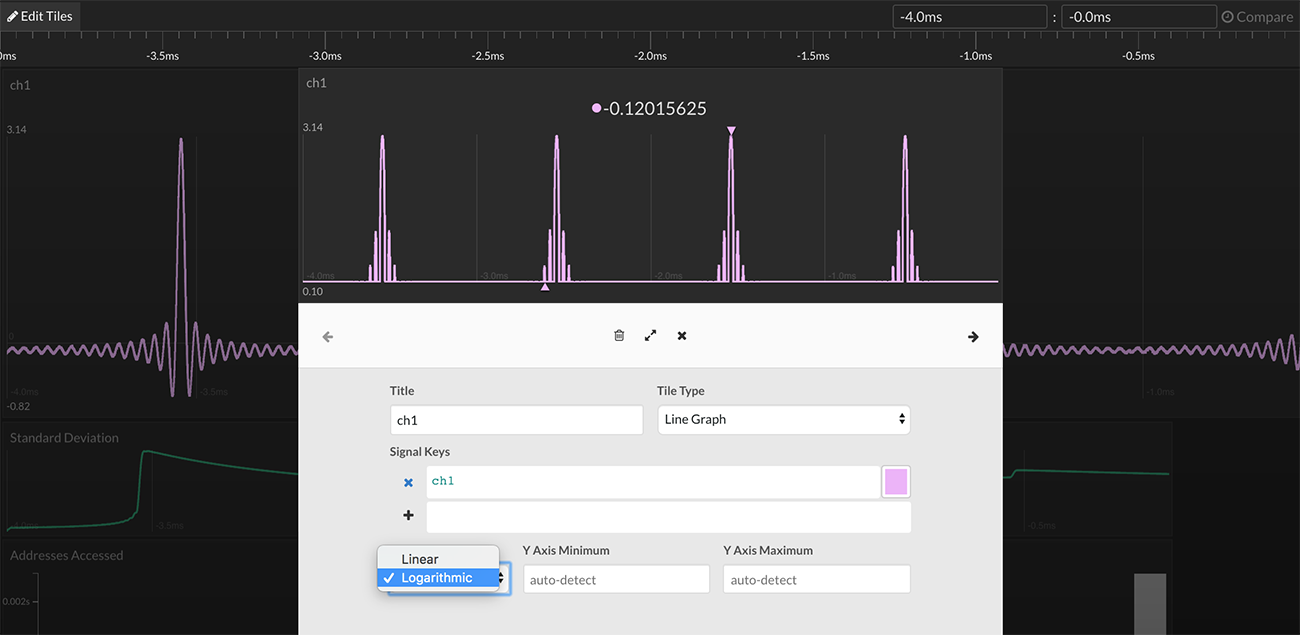
The y-axis can be drawn as either linear or logarithmic.

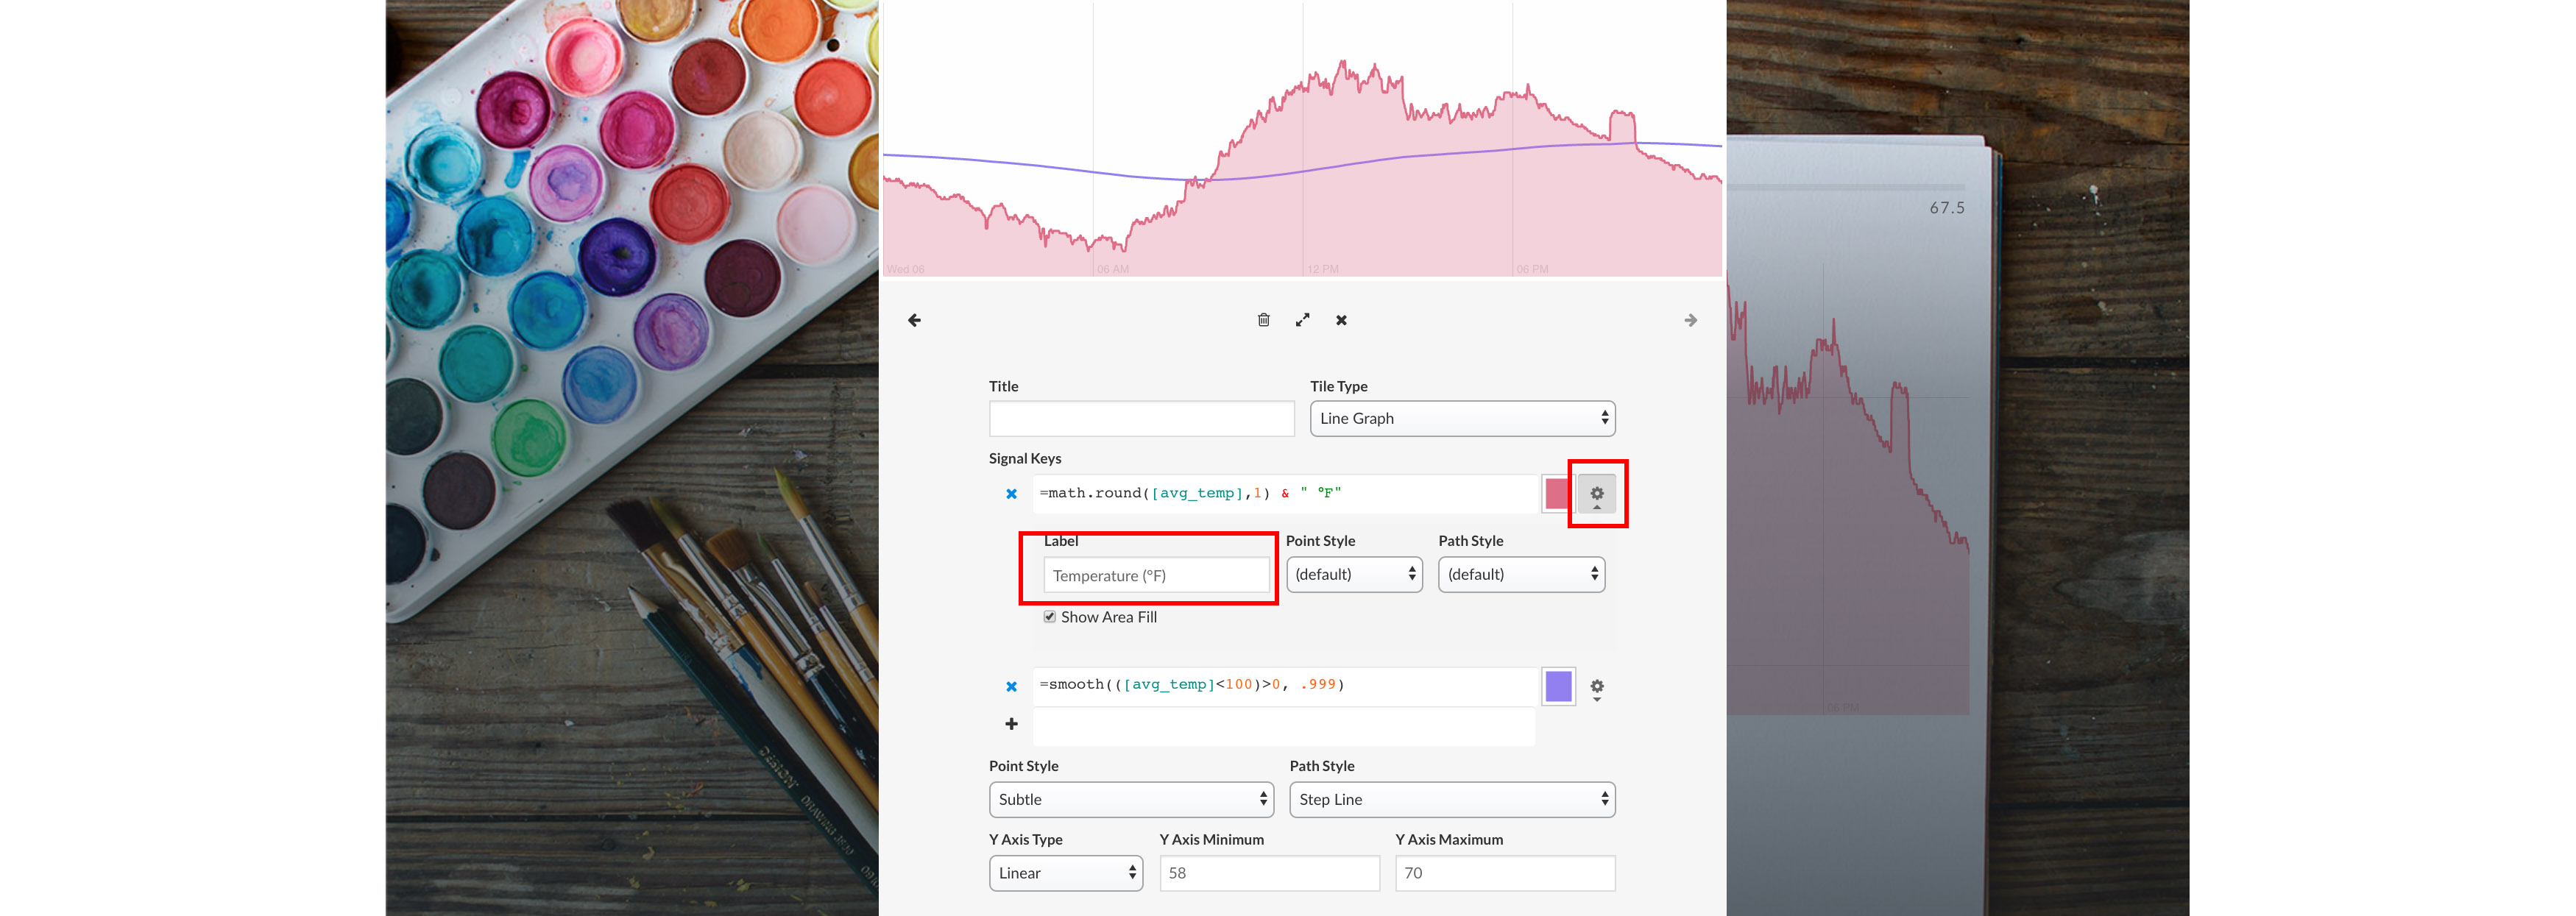
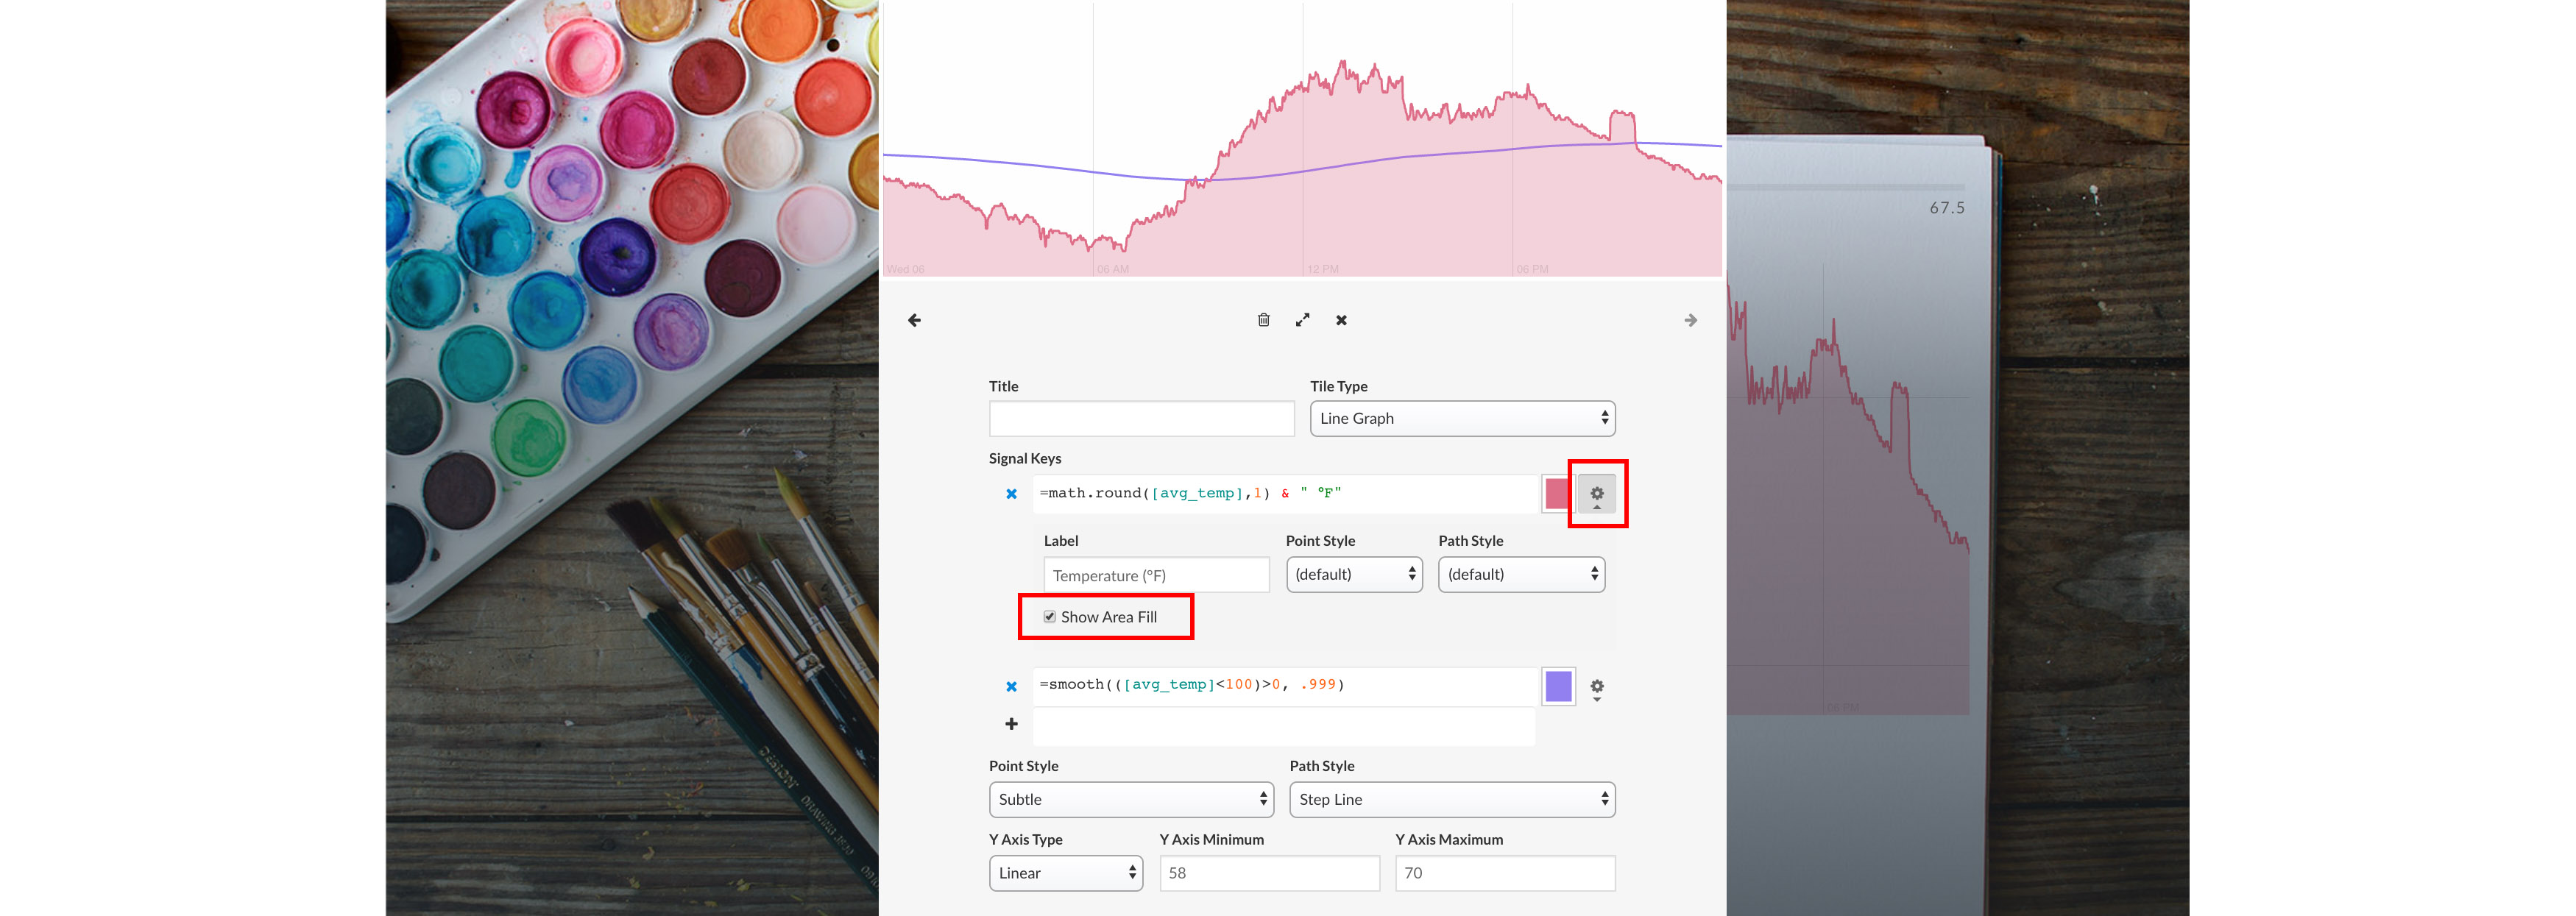
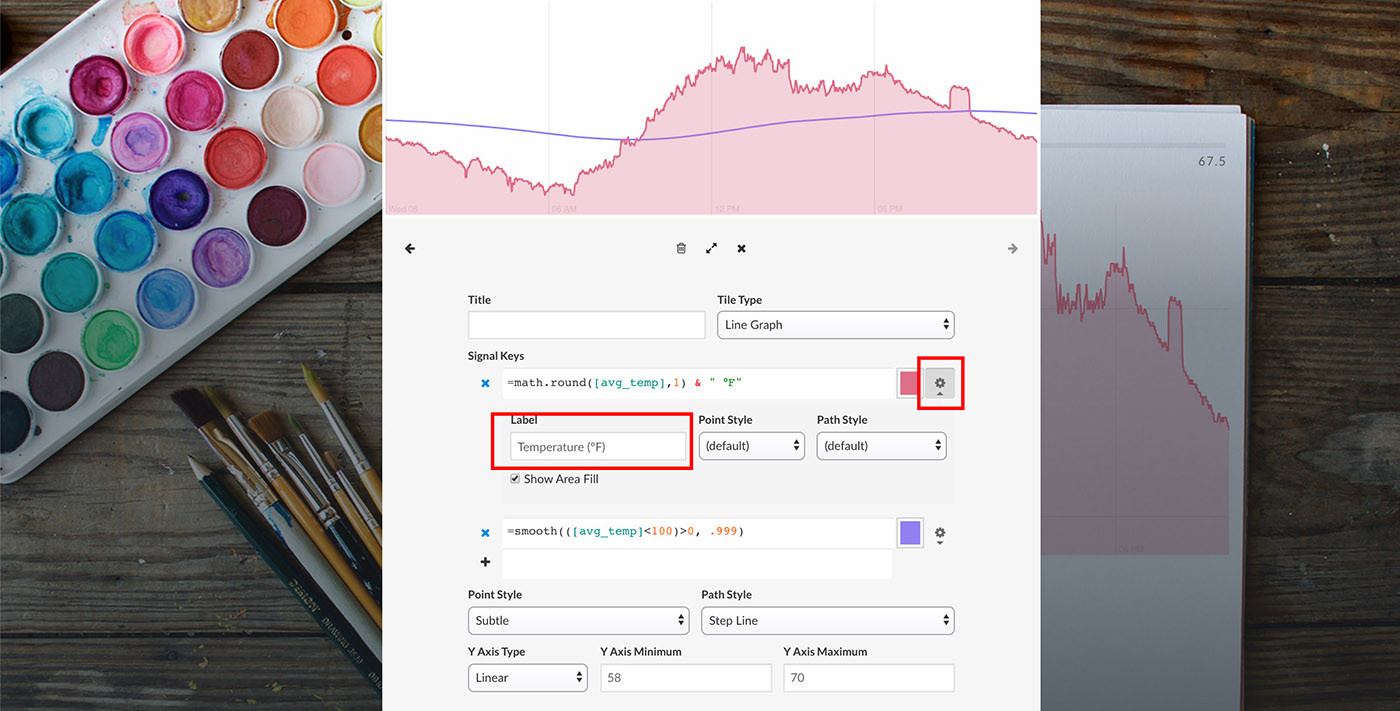
The label of the signal that is displayed on hover can be set by clicking on the additional options icon.

The area under the line can be auto filled by selecting the Show Auto Fill option under the additional options.
Size/Dimension Options
The line graph view will draw x and y axis gridlines when sized larger than the default size.
Hover
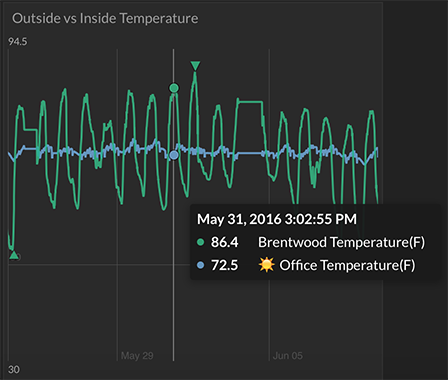
The timestamp and values of each signal at a specific point in time can be seen on hover.
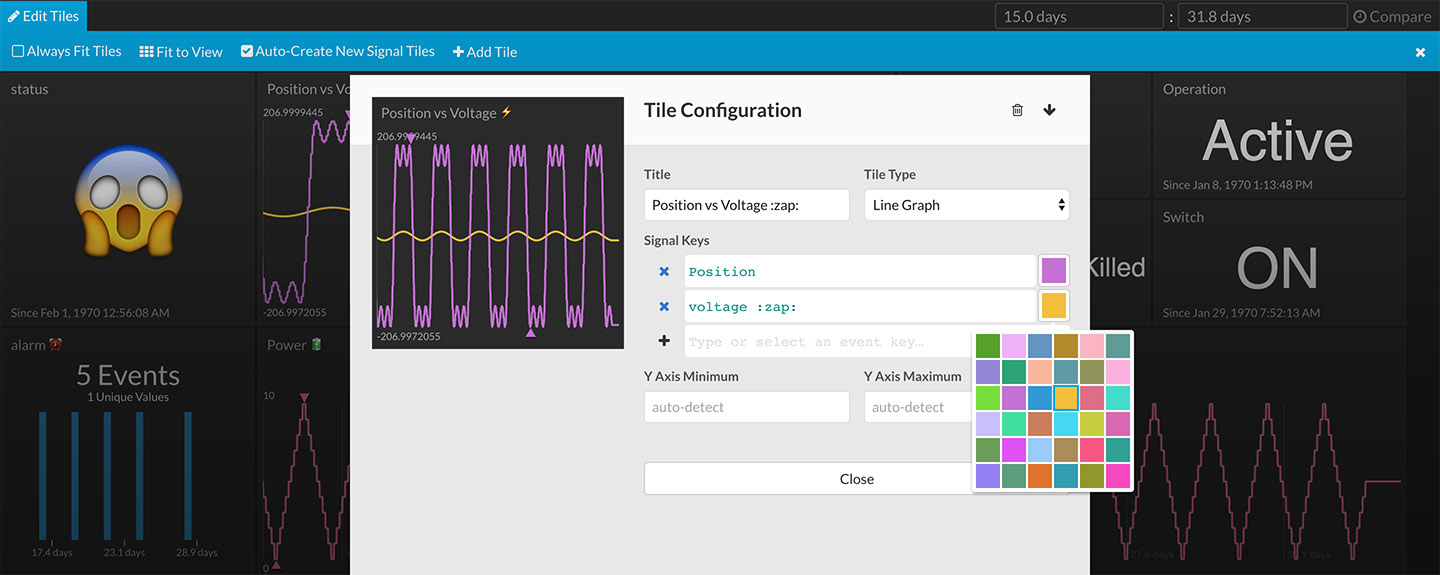
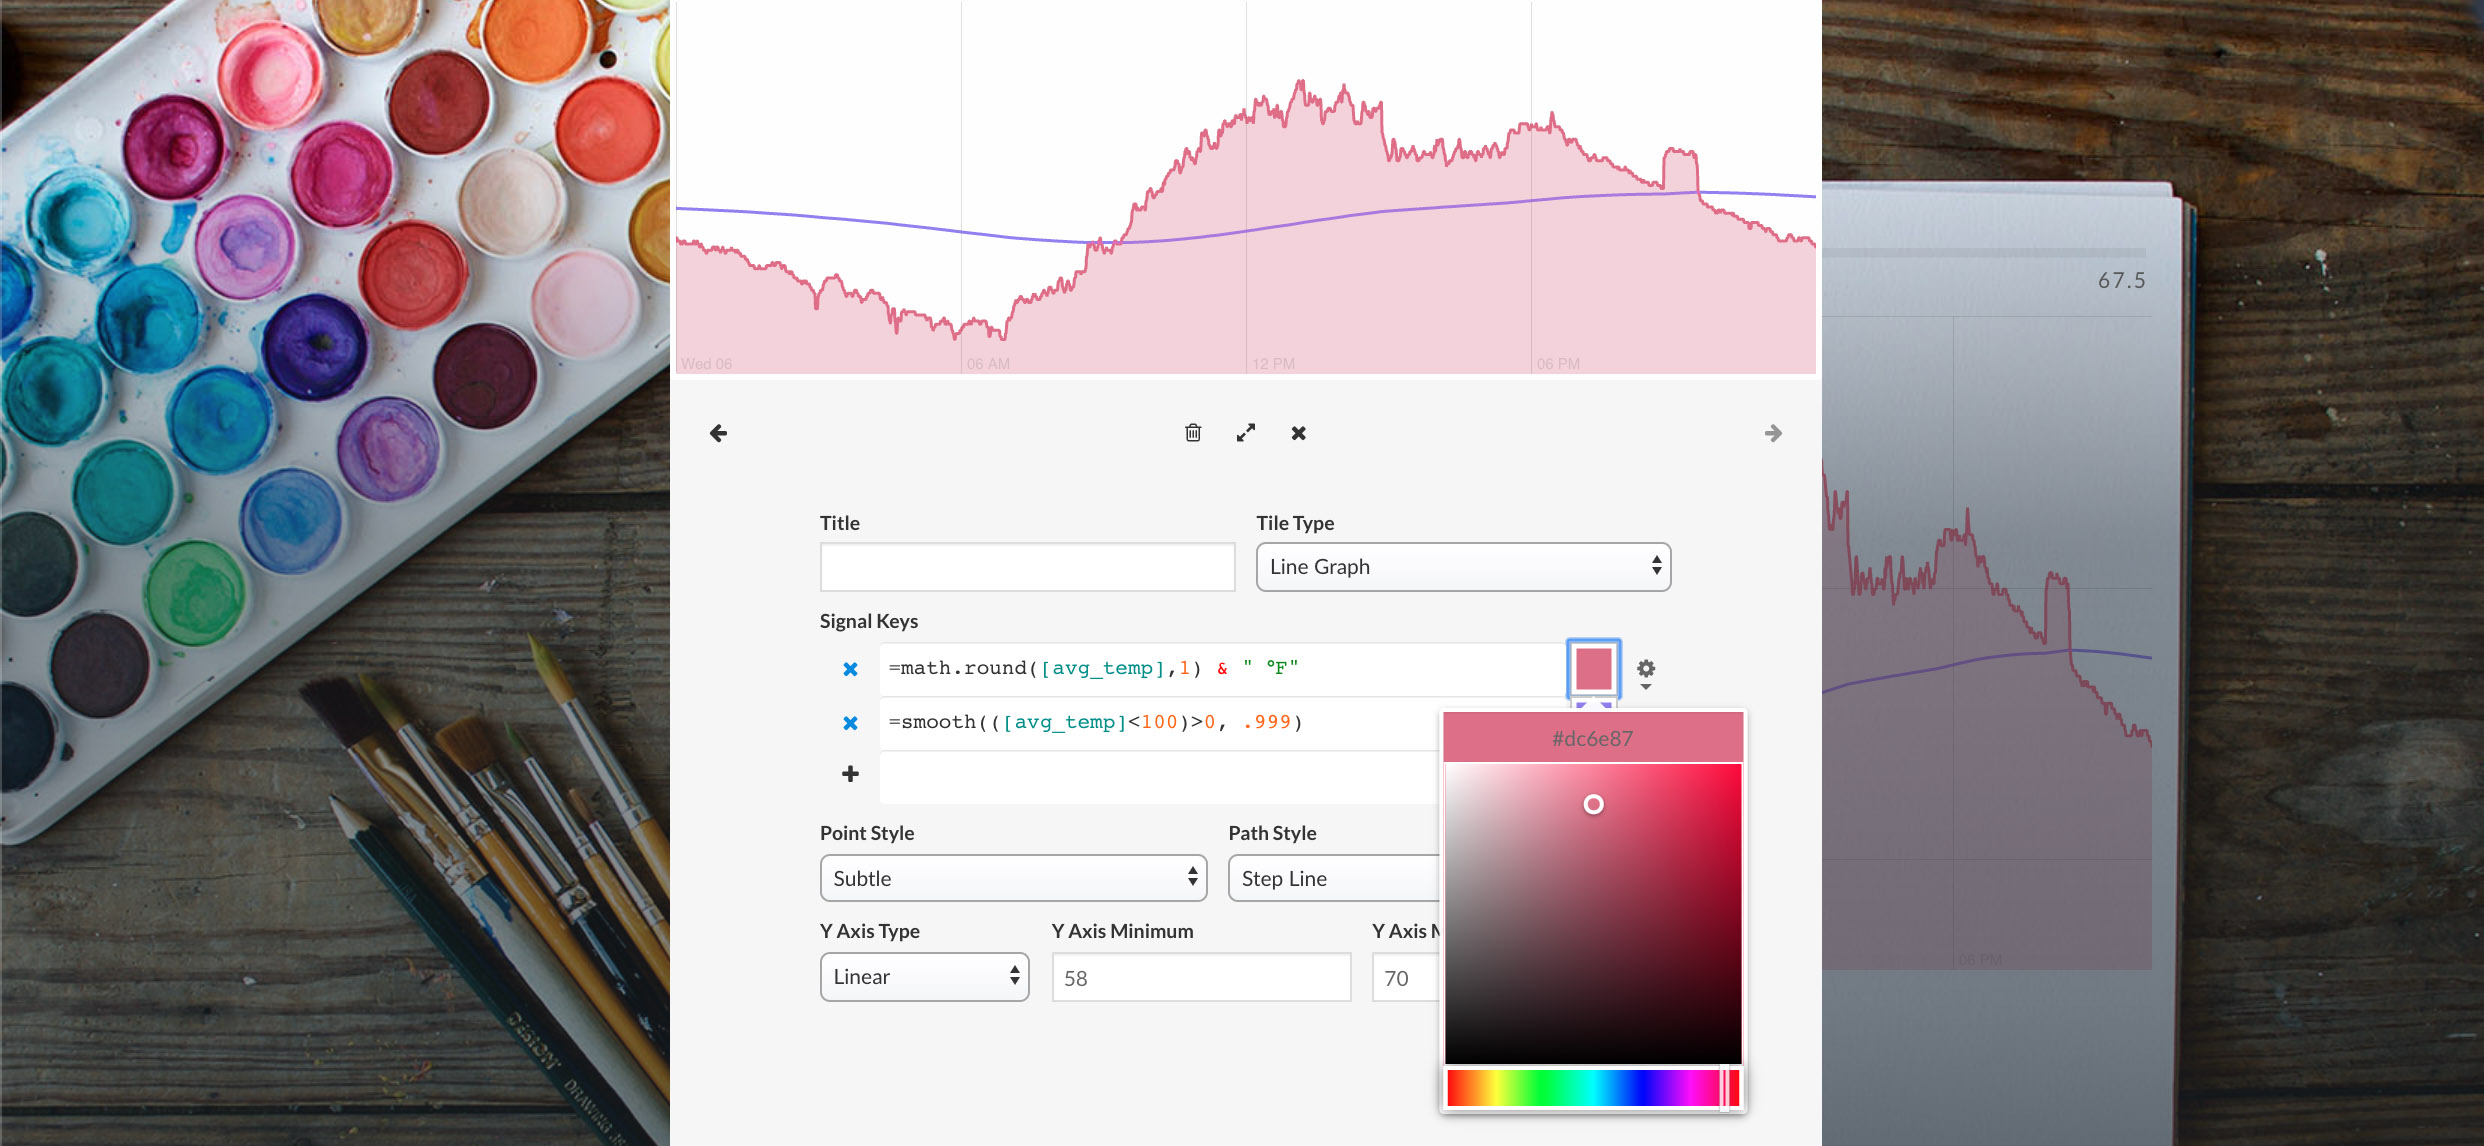
Color Options

Zoom and Pan
To zoom into an area of the line graph, left click -> drag the desired zoom area. This will zoom the entire dashboard into the specified time range.

While in "Expand Tile"mode, the line graph can be zoomed in on both the x and y axis:
- Expand Tile (right-click -> Expand Tile from dropdown menu)
- Use mouse wheel to zoom in and out
-
Use mouse left-click + drag to move pan left/right/up/down
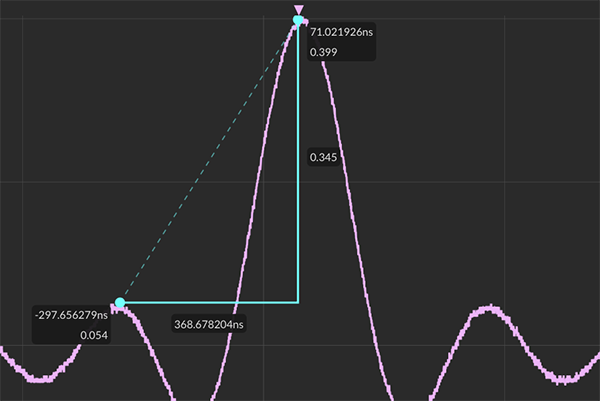
Measurements

Measure magnitude and time with the Tiles line graph measurement tool.
To use the measurement tool for line graph tile types in Tiles:
- Expand Tile (right-click -> Expand Tile from dropdown menu)
- Click the measurement icon at the bottom menu

-
Use mouse left-click + drag to draw a measurement triangle
- Use mouse left-click + drag to move or resize the measurement triangle
- Click the measurement icon at the bottom menu to clear the measurement triangle
Reference Line
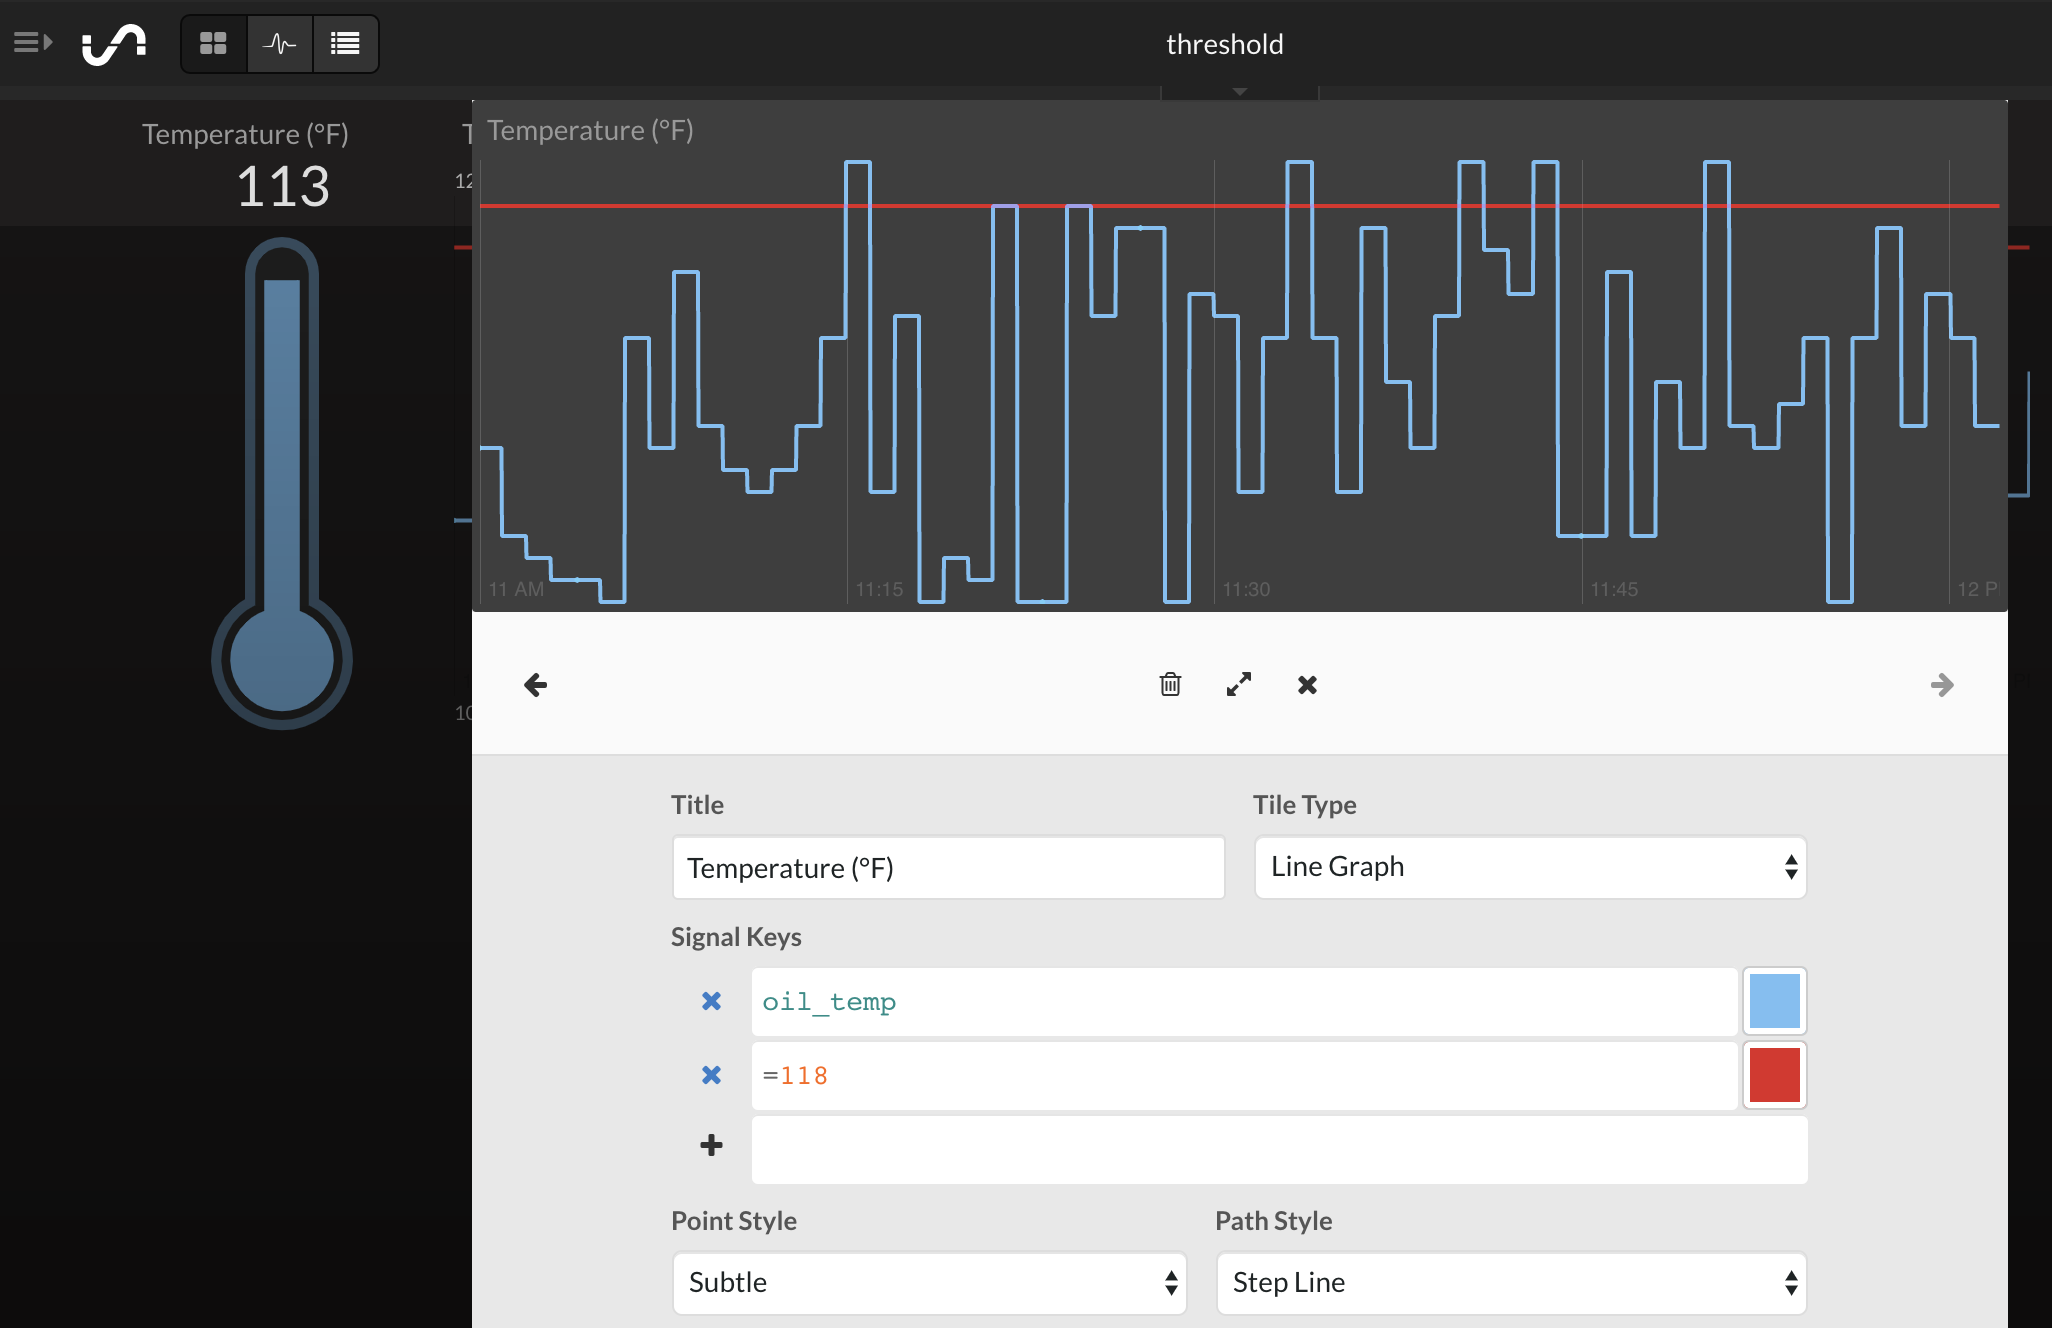
You can add a reference line to your line graph to view when your signal is outside your threshold.
- Expand Tile (right-click -> Expand Tile from dropdown menu)
- Click the plus (+) sign to add a threshold value.
- In the box use "=[value]".
Shortcut Keys
| Right/Left/Up/Down Arrows | Directional pan |
|
+/- |
Zoom in and out |
|
Esc |
Exit expanded tile view |