Data View Type - Map
Data streams that contains location data (e.g. latitude/longitude) can be drawn on a Map using the Map view option in Tiles. Each data point in the data stream will be plotted on top of an interactive map in real-time.
Interacting with the Map View
Selecting the Map View
The map view in Tiles will display location data for a data stream. The map will only recognize location data in the form of Decimal Latitude and Longitude (36.1667,-86.7833) or Degree, Minutes, Seconds (36° 10' 0" N 86° 46' 0” W). The location data must be sent as one data point inside a single data stream. A data stream that contains only valid latitude/longitude coordinates should automatically draw as a map. To manually select the Map view option in Tiles, first right-click on the desired tile (or long press if you are using a touchscreen device) and select Edit Tile from the pop-up menu, then choose the Map view in the Type drop-down menu.
Zooming In/Out
| SHIFT+Drag | You can zoom into a specific area using SHIFT + Mouse Click + Drag to highlight the desired area for zoom. |
|
Mouse Wheel |
You can use the mouse wheel to zoom in and out. |
|
+/- |
You can zoom in and out by a level factor of 1 using the '+' and '-' keys. |
|
SHIFT +/- |
You can zoom in and out by a level factor of 2 using the SHIFT and +/- keys. |
|
Mouse Double Click |
You can zoom in by a level factor of 1 with a mouse double click. |
|
Touch Double Tap |
You can zoom in by a level factor of 1 with a touch double tap. |
|
2 Finger Touch Pinch |
You can zoom in and out with a 2 finger touch pinch. |
Map Tilt
| SHIFT+Arrow Keys | You can tilt the entire map on the z-axis using the SHIFT + Keyboard Up/Down Arrows. You can rotate the entire map using SHIFT + Keyboard Right/Left Arrows. |
|
2 Finger Touch Twist |
You can rotate the entire map with a 2 finger touch twist. |
Map Pan
| Arrow Keys | You can pan left, right, up, and down 80 pixels by using the Keyboard Arrow Keys. |
|
Mouse Drag |
You can pan in any direction with a mouse click + Drag. |
|
1-Touch Drag |
You can in any direction with a single touch + Drag. |
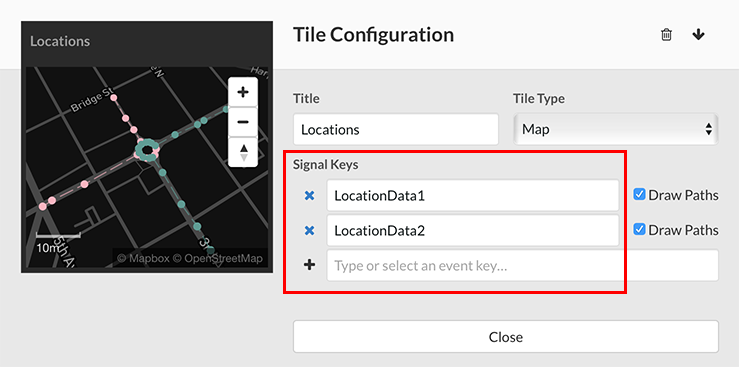
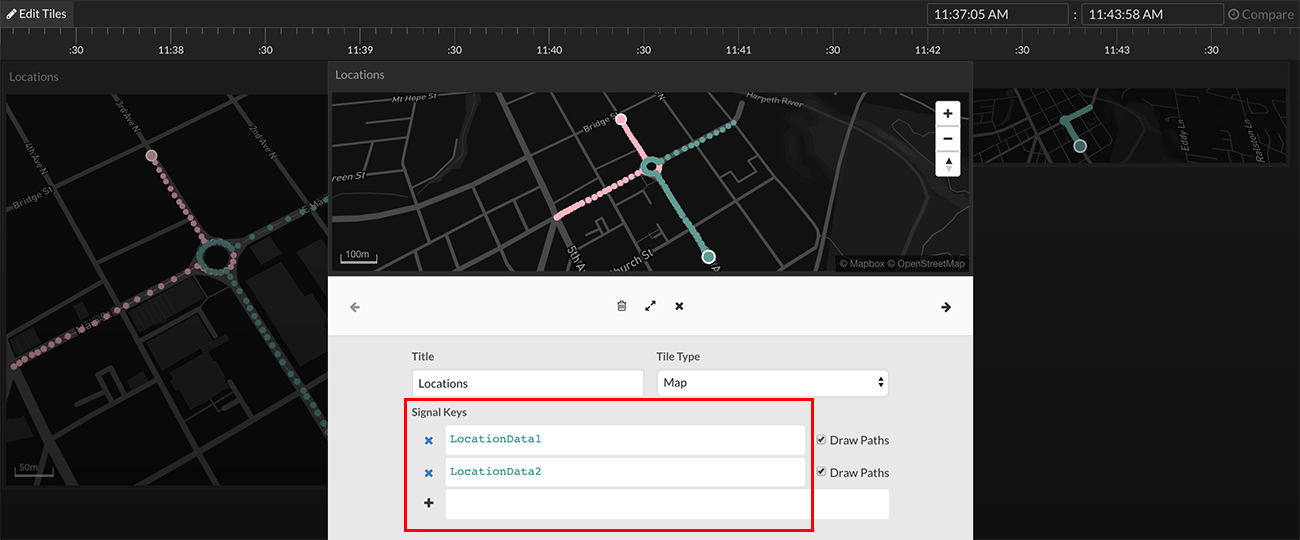
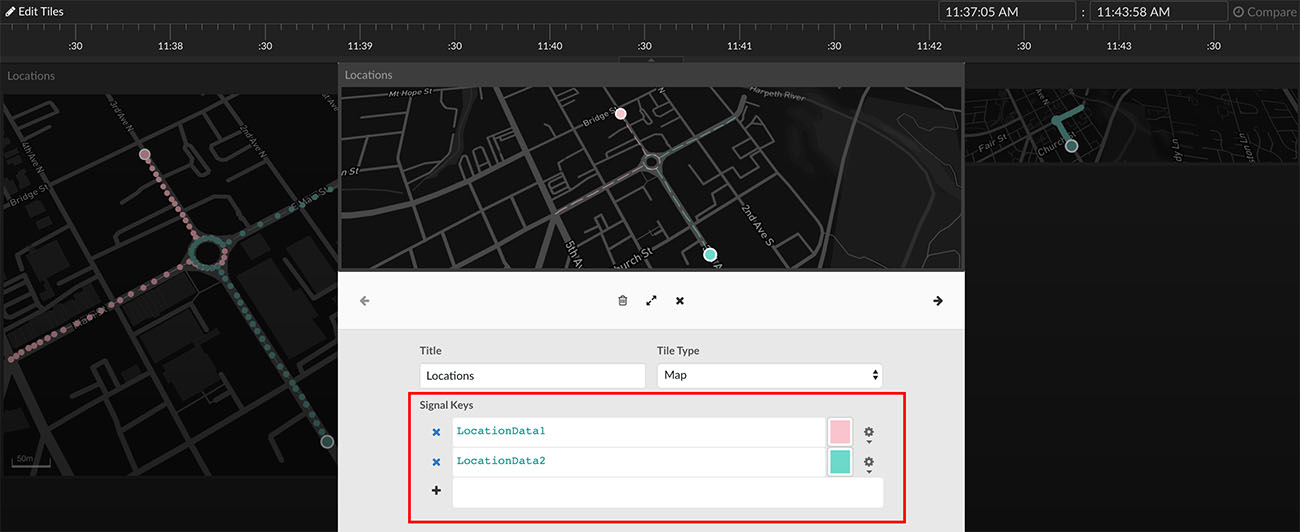
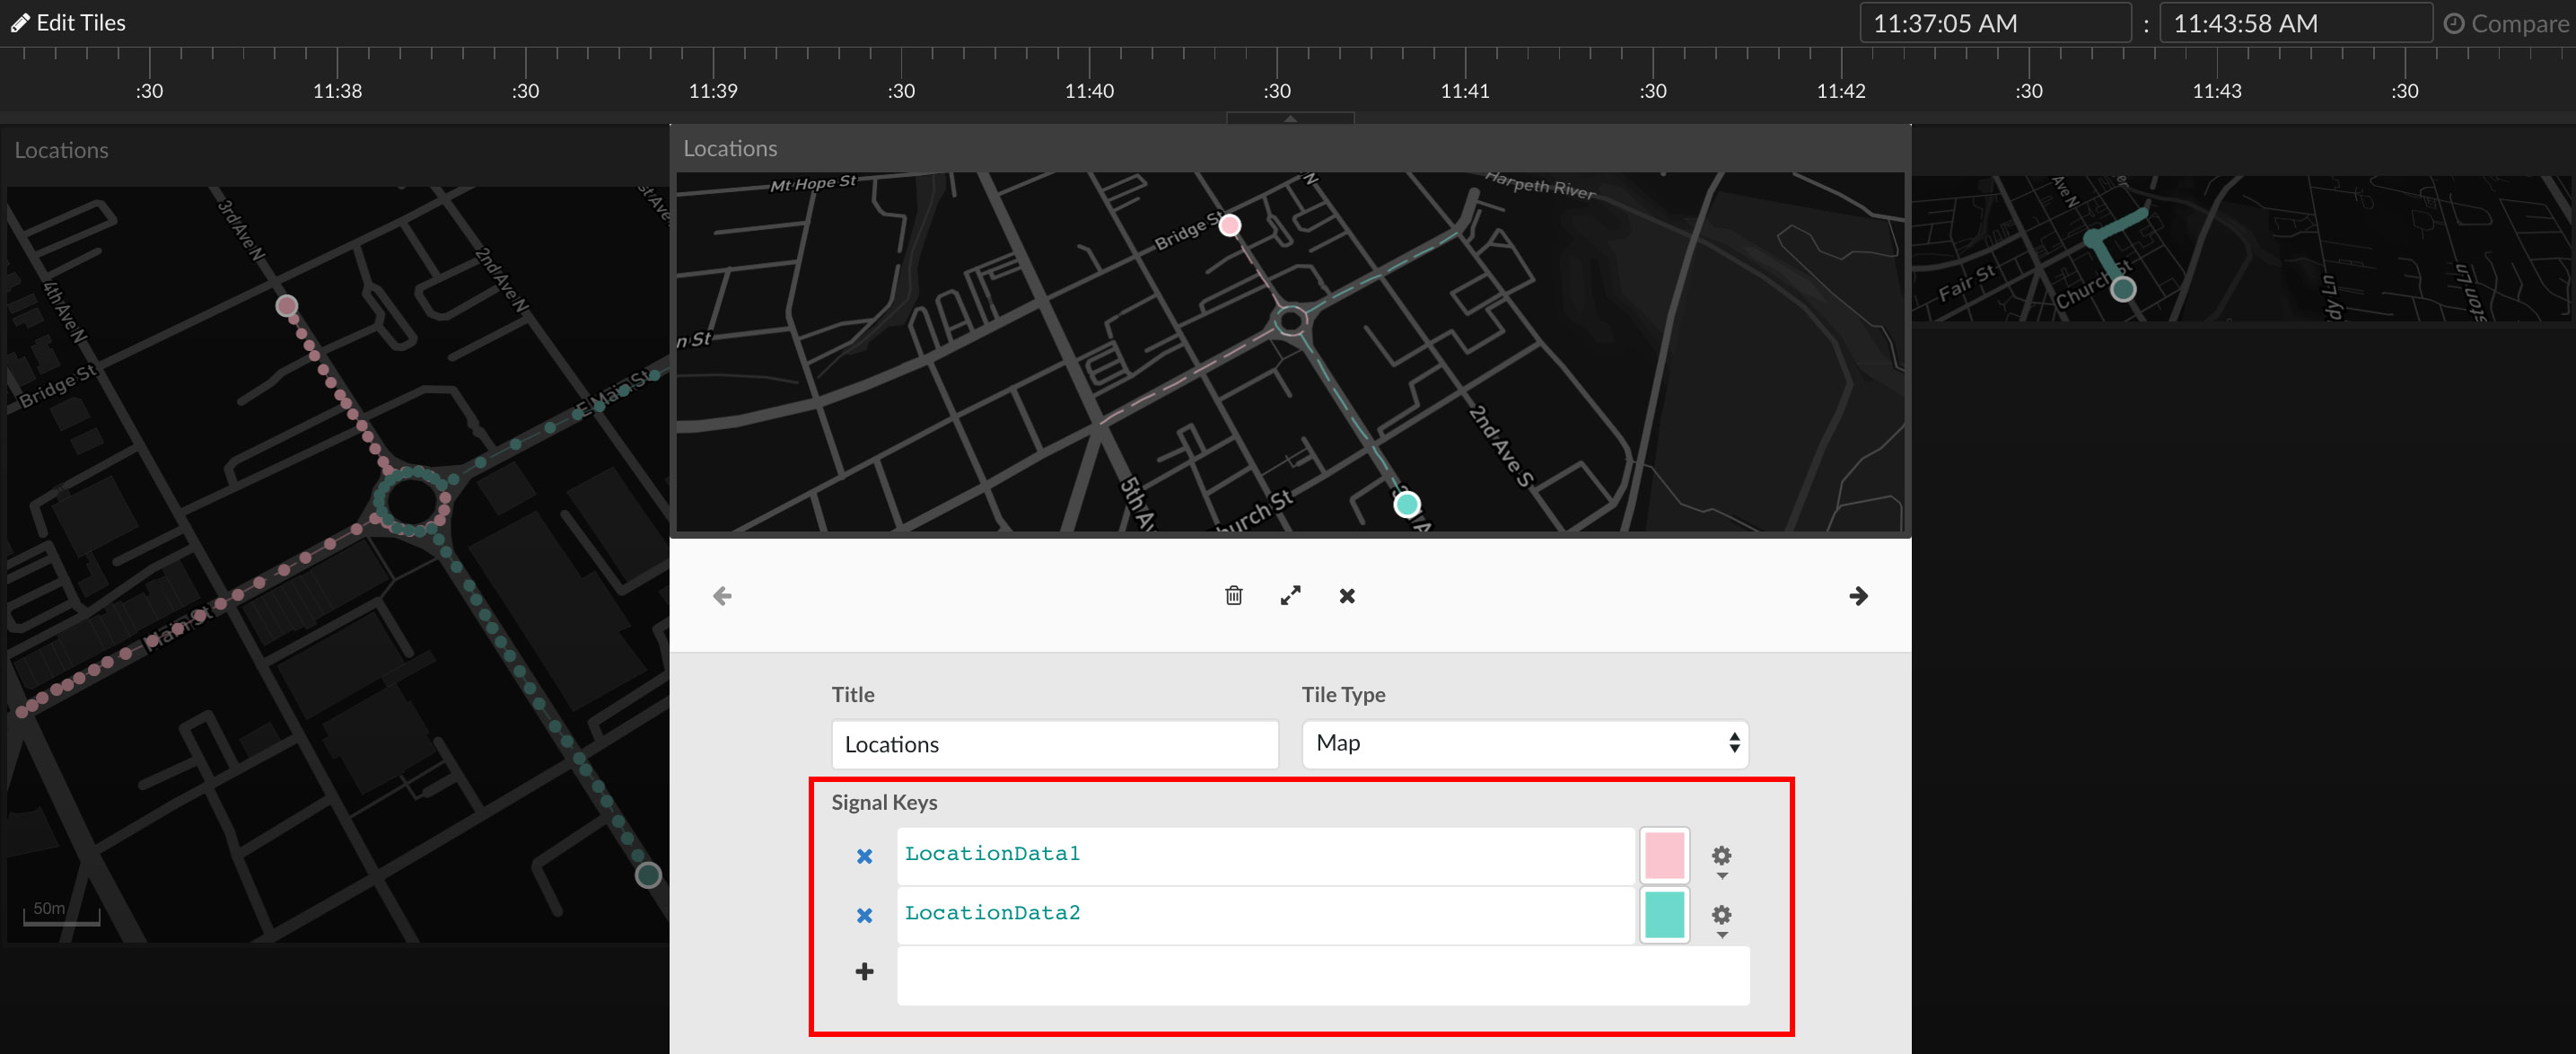
Tile Configuration

Multiple signals can be placed within a single line graph view tile using the Signal Keys section.

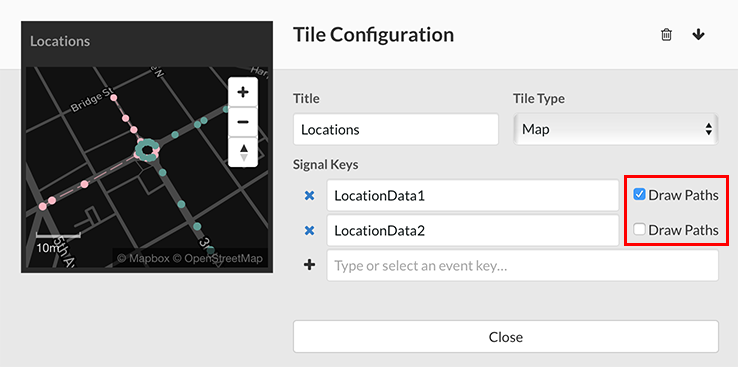
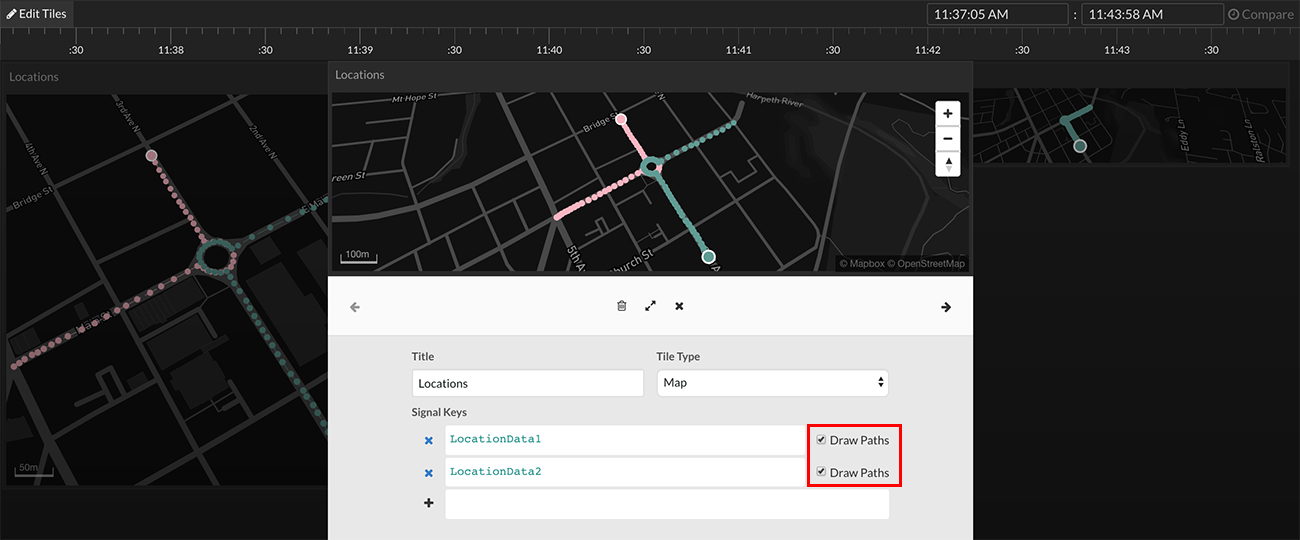
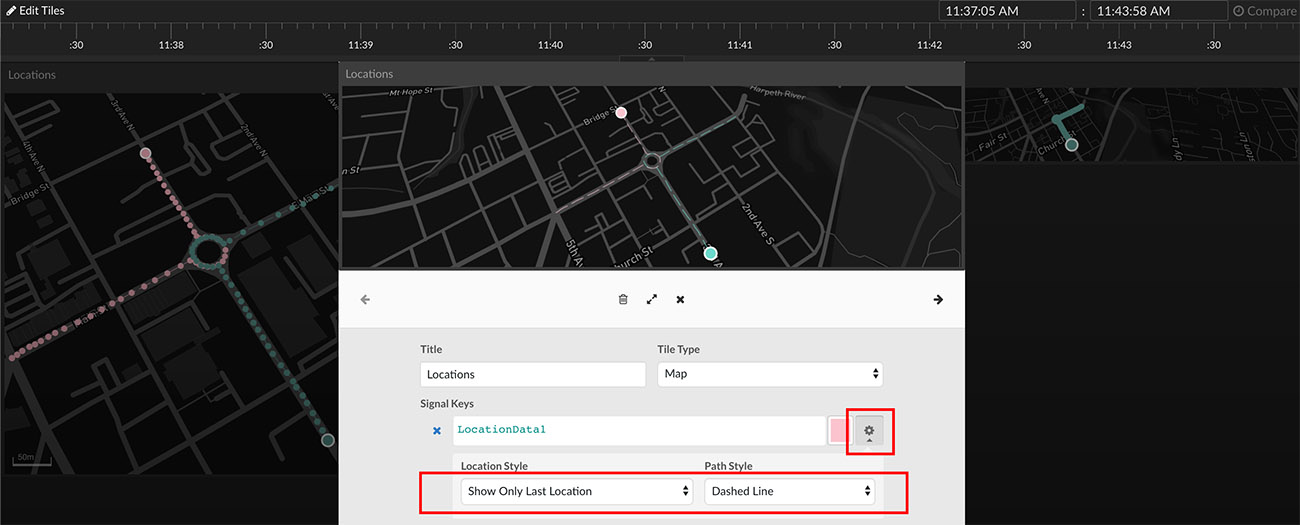
Location style (Hide Locations, Show All Locations, Show Only Last Location) can be selected in the Location Style dropdown box. Path style (No Path, Dashed Line) can be selected in the Path Style dropdown box.
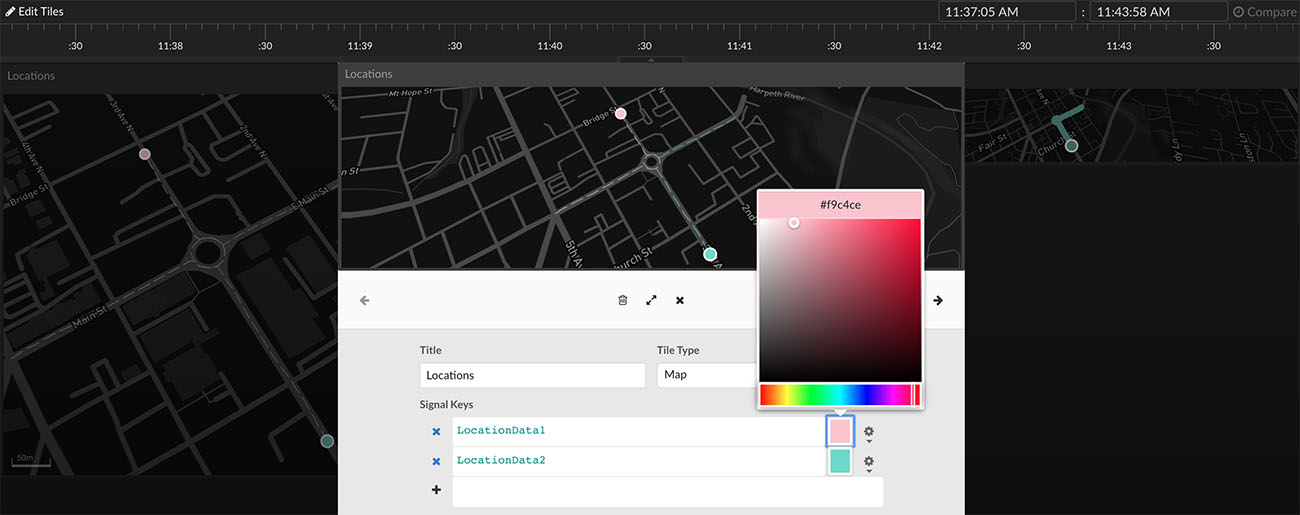
Color Options