Data View Type - Gauge
Tile Configuration

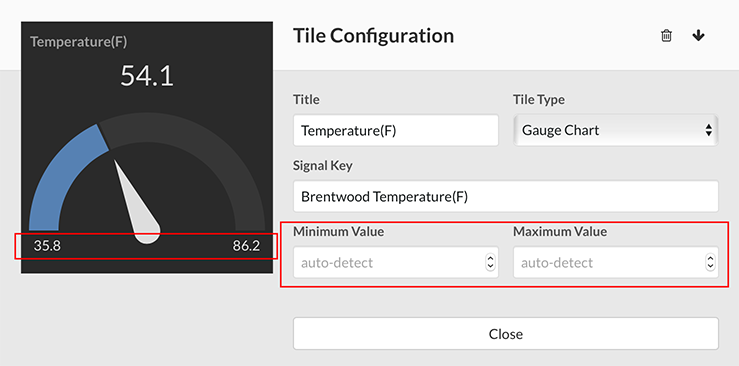
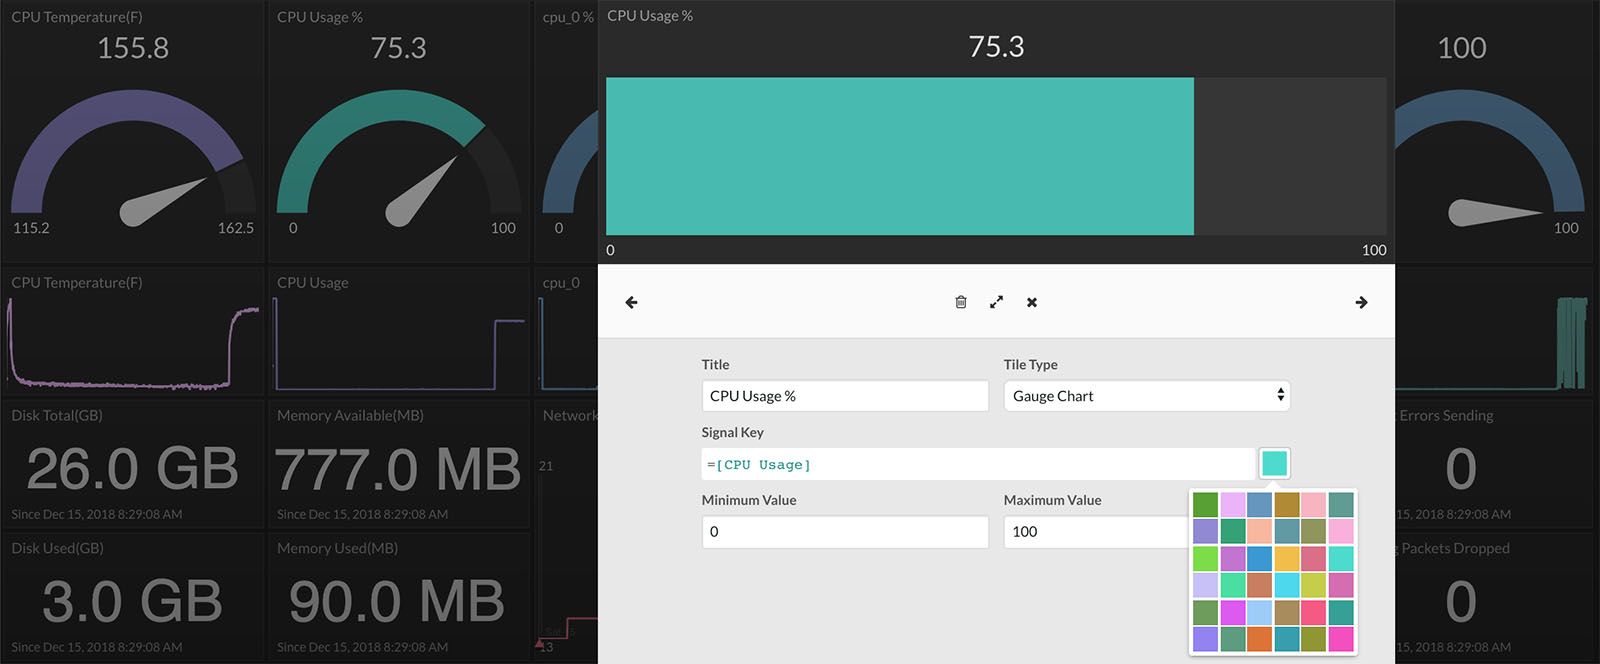
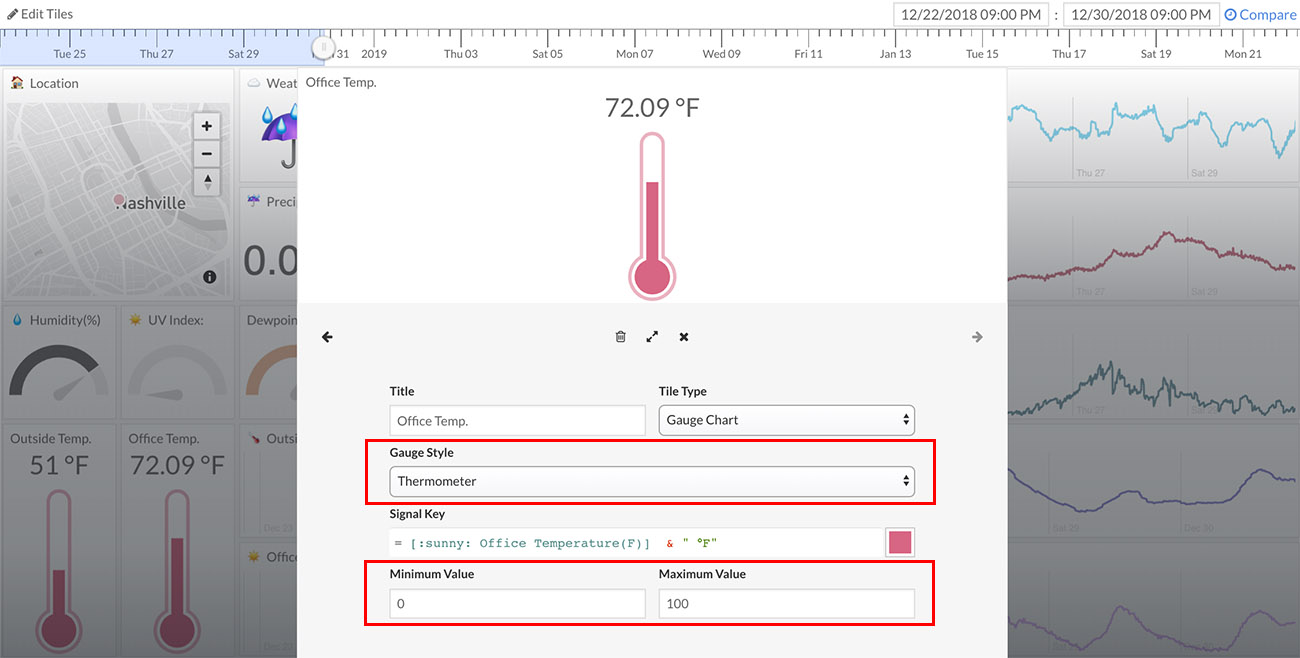
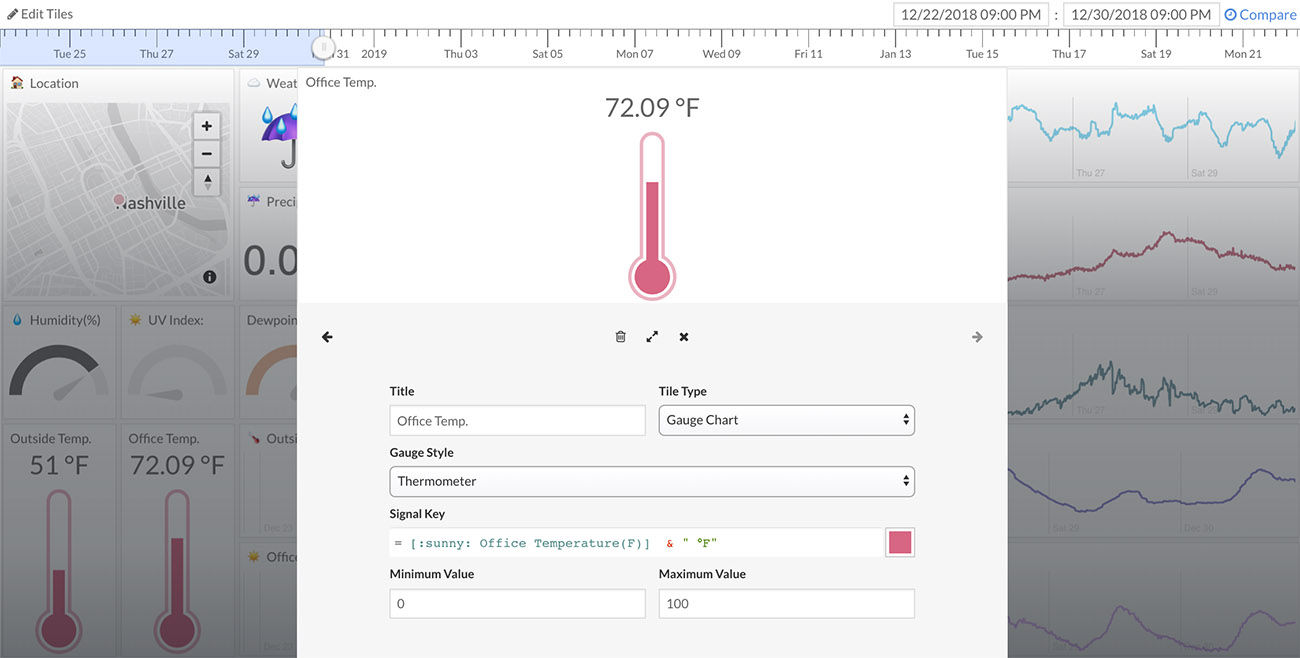
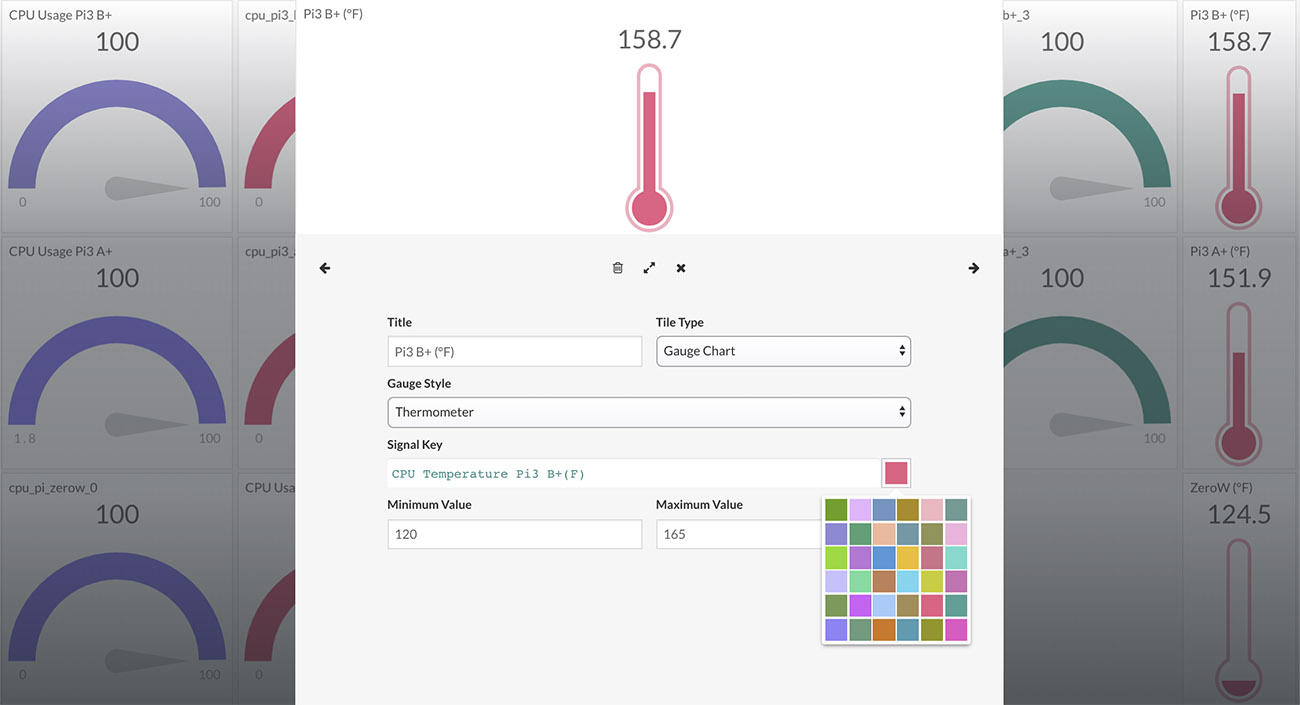
Gauge view options can be set in the Tile Configuration (right-click on tile -> Edit Tile).
Gauge Style
Set the style of the gauge using the Gauge Style dropdown.
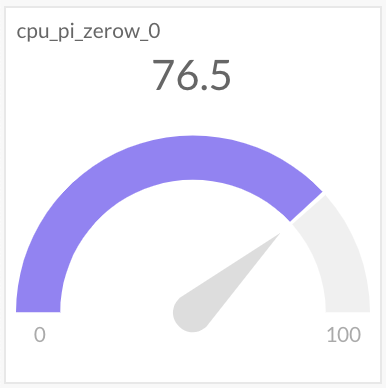
Arc
Bar
*note: The Bar gauge view will change between horizontal and vertical based on the dimensions of the tile.
Liquid
*note: The liquid gauge view is animated.
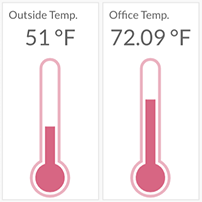
Thermometer
Range
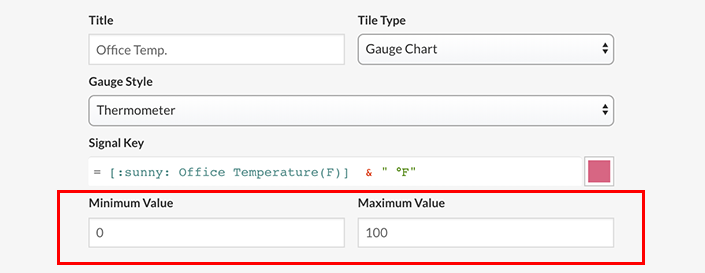
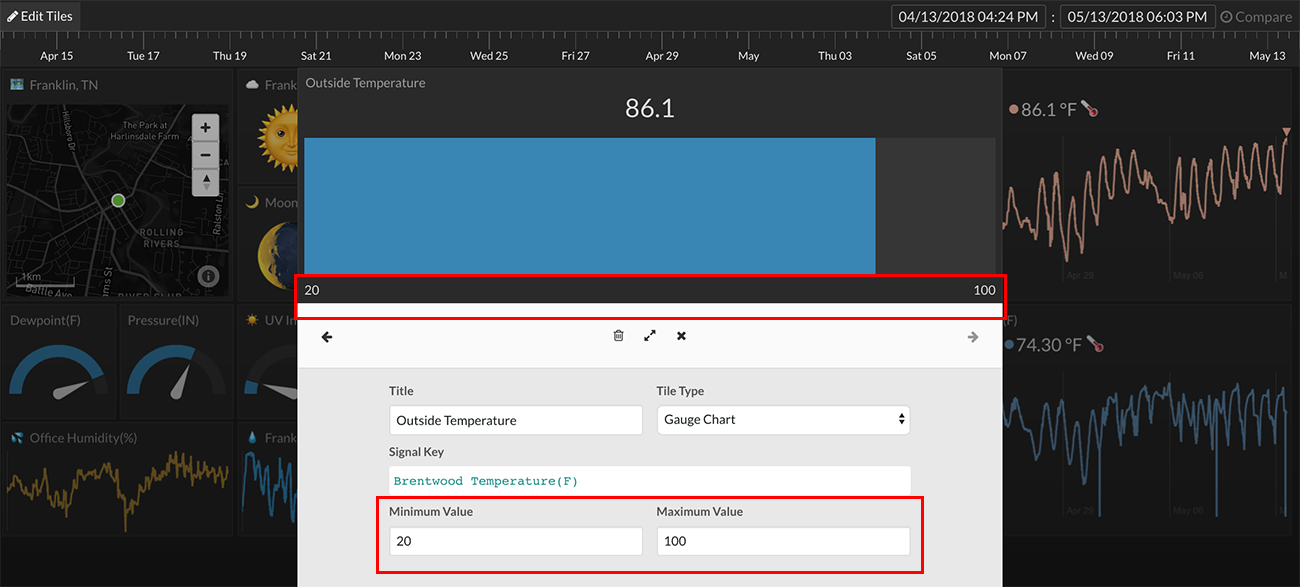
The gauge range can be set using the Minimum Value and Maximum Value fields. If left empty, the range will default to the min and max values detected in the dataset.
Color Options

The color of the gauge graph can be selected using the color picker in the Tile Configuration.
Color Thresholds
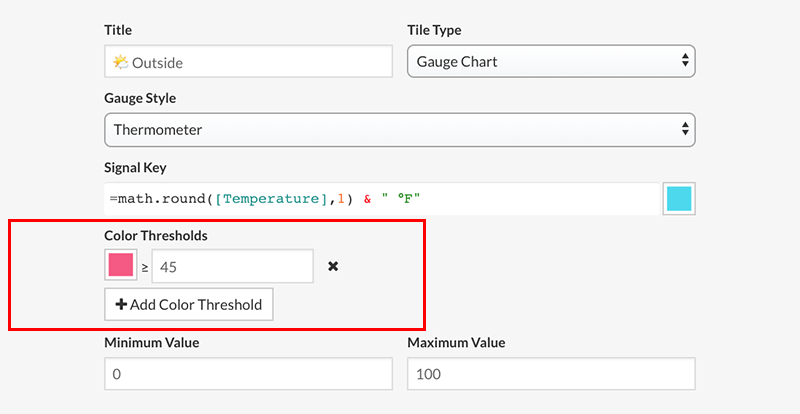
The color of the gauge graph can be setup to change based on the numeric range of the data. For example, change to blue if Temperature is less than 45. One or more color thresholds can be set using the "Color Thresholds" section in the Tile Configuration:
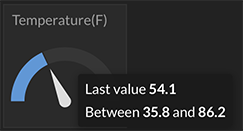
Hover
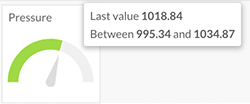
For small tile sizes, the last value and range text is removed from the tile view. These values can be seen on hover.